

SAT Math scores In Chapter 3, we examined data on the percent of high school graduates in
Question:
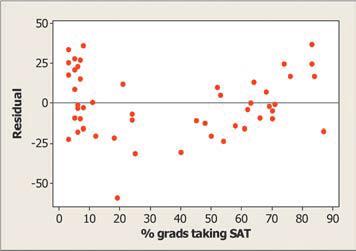
SAT Math scores In Chapter 3, we examined data on the percent of high school graduates in each state who took the SAT and the state’s mean SAT Math score in a recent year. The figure below shows a residual plot for the least-squares regression line based on these data. Explain why the conditions for performing inference about the slope b of the population regression line are not met.
Step by Step Answer:

This question has not been answered yet.
You can Ask your question!
Related Book For 
Question Posted:
