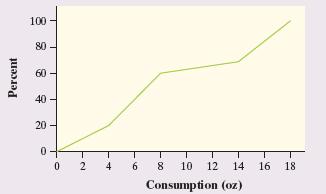
The figure shows a cumulative relative frequency graph of the number of ounces of alcohol consumed per
Question:
The figure shows a cumulative relative frequency graph of the number of ounces of alcohol consumed per week in a sample of 150 adults who report drinking alcohol occasionally. About what percent of these adults consume between 4 and 8 ounces per week?

(a) 20%
(b) 40%
(c) 50%
(d) 60%
(e) 80%
Step by Step Answer:
Related Book For 

Question Posted:


