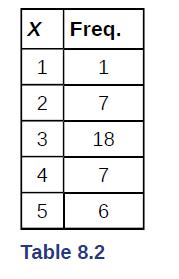
Calculate the following: a. lower limit b. upper limit c. error bound The data in Table 8.2
Question:
Calculate the following:
a. lower limit
b. upper limit
c. error bound The data in Table 8.2 are the result of a random survey of 39 national flags (with replacement between picks) from various countries. We are interested in finding a confidence interval for the true mean number of colors on a national flag. Let X = the number of colors on a national flag.

Fantastic news! We've Found the answer you've been seeking!
Step by Step Answer:
Related Book For 

Introductory Business Statistics
ISBN: 202318
1st Edition
Authors: Alexander Holmes , Barbara Illowsky , Susan Dean
Question Posted:


