

The 95% confidence interval is_____. The data in Table 8.2 are the result of a random survey
Question:
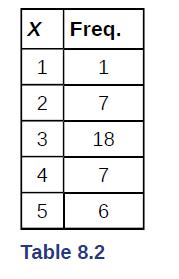
The 95% confidence interval is_____.
The data in Table 8.2 are the result of a random survey of 39 national flags (with replacement between picks) from various countries. We are interested in finding a confidence interval for the true mean number of colors on a national flag. Let X = the number of colors on a national flag.
Fantastic news! We've Found the answer you've been seeking!
Step by Step Answer:

Answered By
Kainat Shabbir
i am an experienced qualified expert with a long record of success helping clients overcome specific difficulties in information technology, business and arts greatly increasing their confidence in these topics. i am providing professional services in following concerns research papers, term papers, dissertation writing, book reports, biography writing, proofreading, editing, article critique, book review, coursework, c++, java, bootstarp, database.
184+ Reviews
255+ Question Solved
Related Book For 
Introductory Business Statistics
ISBN: 202318
1st Edition
Authors: Alexander Holmes , Barbara Illowsky , Susan Dean
Question Posted:
