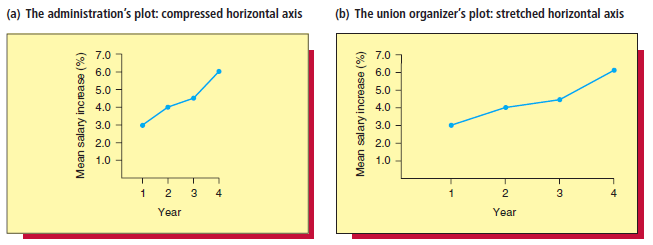
Figure 2.32 gives two more time series plots of the previously discussed mean nurses salary increases. In
Question:
Figure 2.32

Transcribed Image Text:
(b) The union organizer's plot: stretched horizontal axis (a) The administration's plot: compressed horizontal axis * 7.0 7.0 6.0 6.0 5.0 - 5.0 4.0 4.0 - 3.0 - 3.0 - 2.0 - 2.0 - 1.0 - 1.0 - 3. 4 1 4 Year Year Mean salary increase (%) Mean salary increase (%)
Fantastic news! We've Found the answer you've been seeking!
Step by Step Answer:
Answer rating: 50% (16 reviews)
The administrations compressed plot indicate...View the full answer

Answered By

Ashington Waweru
I am a lecturer, research writer and also a qualified financial analyst and accountant. I am qualified and articulate in many disciplines including English, Accounting, Finance, Quantitative spreadsheet analysis, Economics, and Statistics. I am an expert with sixteen years of experience in online industry-related work. I have a master's in business administration and a bachelor’s degree in education, accounting, and economics options.
I am a writer and proofreading expert with sixteen years of experience in online writing, proofreading, and text editing. I have vast knowledge and experience in writing techniques and styles such as APA, ASA, MLA, Chicago, Turabian, IEEE, and many others.
I am also an online blogger and research writer with sixteen years of writing and proofreading articles and reports. I have written many scripts and articles for blogs, and I also specialize in search engine
I have sixteen years of experience in Excel data entry, Excel data analysis, R-studio quantitative analysis, SPSS quantitative analysis, research writing, and proofreading articles and reports. I will deliver the highest quality online and offline Excel, R, SPSS, and other spreadsheet solutions within your operational deadlines. I have also compiled many original Excel quantitative and text spreadsheets which solve client’s problems in my research writing career.
I have extensive enterprise resource planning accounting, financial modeling, financial reporting, and company analysis: customer relationship management, enterprise resource planning, financial accounting projects, and corporate finance.
I am articulate in psychology, engineering, nursing, counseling, project management, accounting, finance, quantitative spreadsheet analysis, statistical and economic analysis, among many other industry fields and academic disciplines. I work to solve problems and provide accurate and credible solutions and research reports in all industries in the global economy.
I have taught and conducted masters and Ph.D. thesis research for specialists in Quantitative finance, Financial Accounting, Actuarial science, Macroeconomics, Microeconomics, Risk Management, Managerial Economics, Engineering Economics, Financial economics, Taxation and many other disciplines including water engineering, psychology, e-commerce, mechanical engineering, leadership and many others.
I have developed many courses on online websites like Teachable and Thinkific. I also developed an accounting reporting automation software project for Utafiti sacco located at ILRI Uthiru Kenya when I was working there in year 2001.
I am a mature, self-motivated worker who delivers high-quality, on-time reports which solve client’s problems accurately.
I have written many academic and professional industry research papers and tutored many clients from college to university undergraduate, master's and Ph.D. students, and corporate professionals. I anticipate your hiring me.
I know I will deliver the highest quality work you will find anywhere to award me your project work. Please note that I am looking for a long-term work relationship with you. I look forward to you delivering the best service to you.
3.00+
2+ Reviews
10+ Question Solved
Related Book For 

Business Statistics In Practice Using Data Modeling And Analytics
ISBN: 9781259549465
8th Edition
Authors: Bruce L Bowerman, Richard T O'Connell, Emilly S. Murphree
Question Posted:
Students also viewed these Mathematics questions
-
Open the stock market data file called 2006Stocks. Create time series plots of the Dow and S& P. Both time series should be on the same graph. This graph helps to demonstrate that when variables are...
-
The time series plots in Figure 1.9 tell us that the predicted waiting times for Soarin and Test Track at Epcot at 5 p.m. on February 21, 2015 were (approximately) 85 minutes and 60 minutes....
-
Read the approximate predicted waiting times for Soarin and Test Track at 8 p.m. off of the time series plots in Figure 1.9. Construct a hand-drawn bullet graph of these two predicted waiting times....
-
A block of ice with mass 2.00 kg slides 0.750 m down an inclined plane that slopes downward at an angle of 36.9 below the horizontal. If the block of ice starts from rest, what is its final speed?...
-
A company faces two kinds of risk. A firm-specific risk is that a competitor might enter its market and take some of its customers. A market risk is that the economy might enter a recession, reducing...
-
A gas stream containing 40.0mole% hydrogen, 35.0% carbon monoxide, 20.0% carbon dioxide, and 5.0% methane is cooled from 1000C to 10C at a constant absolute pressure of 35.0 atm. Gas enters the...
-
Imagine you are a hospital executive and you want to improve your organizations value proposition. What areas do you need to assess to develop an improvement plan?
-
Harrys Potter's yearly earnings depend on the local weather conditions. If the weather over the year is good (which happens with a probability of .4), Harrys Potter's pre-tax earnings are high and...
-
Why are financial statement analysis important for a company like Lowes? What can they use it for?
-
The demand function is given as: Q = 10 0.5P, and the supply function is given as: Q = P - 2. If a subsidy of $3 is given by the government, what is the price paid by buyers? Answer Choices: . 6. b....
-
In the treemap in Figure 2.41, dark blue represents the lowest ozone level and bright red represents the highest ozone level. Where is the ozone level higher, Chicago or New York City? Treemap of the...
-
Figure 2.5 gives a percentage pie chart of new vehicle market shares in the United States for 2014 as given by GoodCarBadCar.net. Use this pie chart and your results from Exercise 2.9 to write an...
-
Produce a list of the names and addresses of all employees who work for the IT department.
-
Thomson Company's income statement for the year ended December 31, 20X4, reported net income of $360,000. The financial statements also disclosed the following information: Depreciation $60,000...
-
Based on past experience, Maas Corporation (a U.S.-based company) expects to purchase raw materials from a foreign supplier at a cost of 1,800,000 francs on March 15, 2024. To hedge this forecasted...
-
Suppose that laws are passed banning labor unions and that resulting lower labor costs are passed along to consumers in the form of lower prices. Assume that the U.S. economy was in long-run...
-
What's wrong with the following statement? "Because the digits 0, 1, 2,....9 are the normal results from lottery drawings, such randomly selected numbers have a normal distribution." Choose the...
-
Matching Question Drag and drop various responsibilities of employers that are related to workplace values against the corresponding values. Drag and drop application. Justice Justice drop zone...
-
Various activities at Reservations Online, a hotel reservation call centre, are listed below: Required: 1. Classify each activity as unit-level, batch-level, product-level, customer- level, or...
-
A firm has the following balance sheet: Assets Cash Accounts receivable Inventory Plant and equipment $ 15,000 150,000 92,000 170,000 $427,000 Liabilities and Equity Accounts payable Long-term debt...
-
A study was conducted to determine if crocodiles raised in captivity (i.e., in a zoo) grew faster than crocodiles living in the wild. Identify the explanatory variable and the outcome variable....
-
People who walk at least 3 miles a day are randomly selected, and their blood triglyceride levels are measured in order to determine if the number of miles that they walk has any influence on these...
-
In an article in the British Journal of Nutrition, two types of mice were randomly selected. One group received a thyme supplement for a specific time, while another group was used as a control group...
-
why would an auditor want to complete dual-purpose tests? what procedure can be put into place to help prevent fraud? List 4 procedures.
-
Based on the following information, calculate sustainable growth rate for Groot, Inc.: Profit margin= 7.1% Total asset turnover = 1.90 Total debt ratio = .45 Payout ratio = 20% What is the ROA here?
-
Consider the following: a call option on a stock has strike price $100, premium of $5 and the current price of the underlying stock is $100. If you buy the call option today, what is your holding...

Study smarter with the SolutionInn App


