

From Exercise 1, we also have data on how long each person has been with the company
Question:
From Exercise 1, we also have data on how long each person has been with the company (tenure) categorized into three levels: less than one year, between one and five years, and more than five years. A table of the two variables together looks like this:
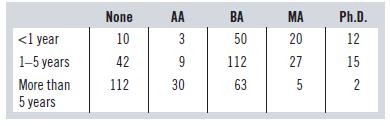
a) Find the marginal distribution of the tenure. (Hint: Find the row totals.)
b) Verify that the marginal distribution of the education level is the same as that given in Exercise 1.
Fantastic news! We've Found the answer you've been seeking!
Step by Step Answer:

Answered By
Utsab mitra
I have the expertise to deliver these subjects to college and higher-level students. The services would involve only solving assignments, homework help, and others.
I have experience in delivering these subjects for the last 6 years on a freelancing basis in different companies around the globe. I am CMA certified and CGMA UK. I have professional experience of 18 years in the industry involved in the manufacturing company and IT implementation experience of over 12 years.
I have delivered this help to students effortlessly, which is essential to give the students a good grade in their studies.
2+ Reviews
10+ Question Solved
Related Book For 

Business Statistics
ISBN: 9780136726548
4th Canadian Edition
Authors: Norean Sharpe, Richard De Veaux, Paul Velleman, David Wright
Question Posted:
