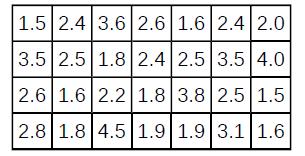
Graph P(2 The data that follow are the square footage (in 1,000 feet squared) of 28 homes.
Question:
Graph P(2
The data that follow are the square footage (in 1,000 feet squared) of 28 homes.

The sample mean = 2.50 and the sample standard deviation = 0.8302.
The distribution can be written as X ~ U(1.5, 4.5).
Step by Step Answer:
Related Book For 

Introductory Business Statistics
ISBN: 202318
1st Edition
Authors: Alexander Holmes , Barbara Illowsky , Susan Dean
Question Posted:


