

Measuring the moons orbit. A handheld digital camera was used to photograph the moons orbit and the
Question:
Measuring the moon’s orbit. A handheld digital camera was used to photograph the moon’s orbit and the results summarized in the American Journal of Physics (Apr.
2014). The pictures were used to measure the angular size
(in pixels) of the moon at various distances (heights) above the horizon (measured in degrees). The data for 13 different heights are illustrated in the graph below and saved in the MOON file.
a. Is there visual evidence of a linear trend between angular size (y) and height above horizon (x)? If so, is the trend positive or negative? Explain.
b. Draw what you believe is the best-fitting line through the data.
c. Draw vertical lines from the actual data points to the line, part
b. Measure these deviations and then compute the sum of squared deviations for the visually fitted line.
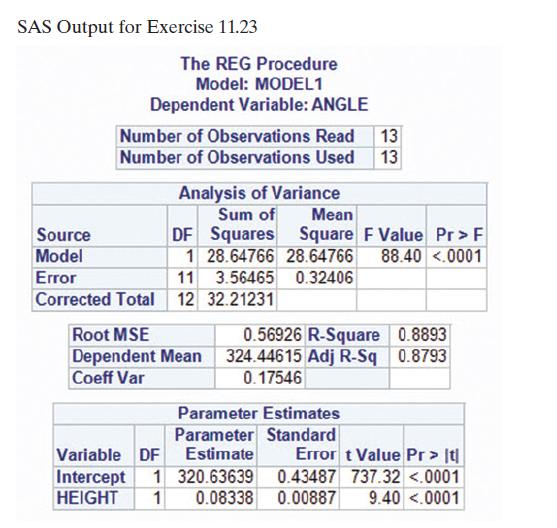
d. An SAS simple linear regression printout for the data is shown in the next column. Compare the y-intercept and slope of the regression line to the visually fitted line, part b.
e. Locate SSE on the printout. Compare this value to the result in part
c. Which value is smaller?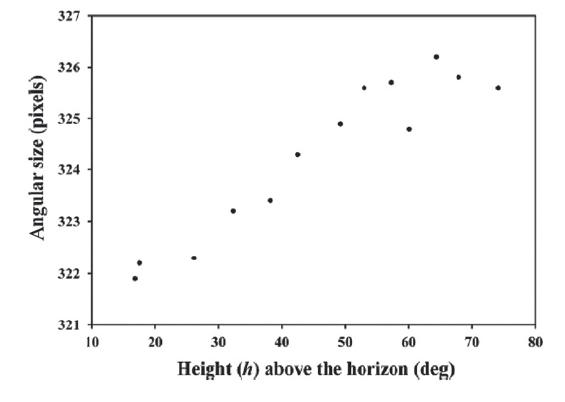
Step by Step Answer:

This question has not been answered yet.
You can Ask your question!


Statistics Plus New Mylab Statistics With Pearson Etext Access Card Package
ISBN: 978-0134090436
13th Edition
Authors: James Mcclave ,Terry Sincich
