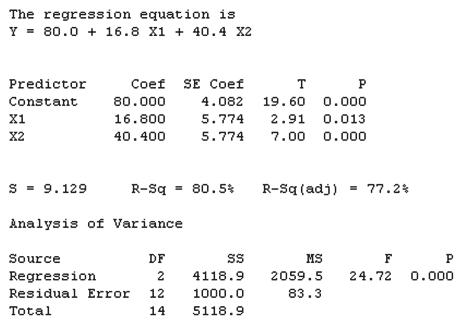
MINITAB was used to fit the model y = b0 + b1 x1 + b2 x2 +
Question:
MINITAB was used to fit the model y = b0 + b1 x1 + b2 x2 + e where x1 = e 1 if level 2 0 if not x2 = e 1 if level 3 0 if not to n = 15 data points. The results are shown in the accompanying MINITAB printout.

a. Report the least squares prediction equation.
b. Interpret the values of b1 and b2.
c. Interpret the following hypotheses in terms of m1, m2, and m3:
H0: b1 = b2 = 0 Ha: At least one of the parameters b1 and b2 differs from 0
d. Conduct the hypothesis test of part c.
Fantastic news! We've Found the answer you've been seeking!
Step by Step Answer:
Related Book For 

Question Posted:


