

MINITAB was used to fit the model y = b0 + b1 x1 + b2 x2 +
Question:
MINITAB was used to fit the model y = b0 +
b1 x1 + b2 x2 + e to n = 20 data points, and the printout on p. 697 was obtained.
a. What are the sample estimates of b0, b1, and b2?
b. What is the least squares prediction equation?
c. Find SSE, MSE, and s. Interpret the standard deviation in the context of the problem.
d. Test H0: b1 = 0 against Ha: b1 0. Use a = .05.
e. Use a 95% confidence interval to estimate b2.
f. Find R2 and Ra 2 and interpret these values.
g. Use the two formulas given in this section to calculate the test statistic for the null hypothesis H0: b1 = b2 = 0.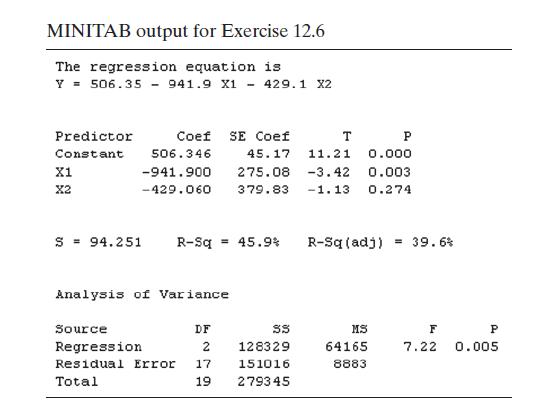
Compare your results with the test statistic shown on the printout.
h. Find the observed significance level of the test you conducted in part g. Interpret the value.
Step by Step Answer:


Statistics Plus New Mylab Statistics With Pearson Etext Access Card Package
ISBN: 978-0134090436
13th Edition
Authors: James Mcclave ,Terry Sincich
