

The following Venn diagram describes the sample space of a particular experiment and events A and B:
Question:
The following Venn diagram describes the sample space of a particular experiment and events A and B: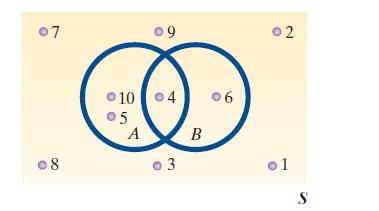
a. Suppose the sample points are equally likely. Find P(A)
and P(B).
b. Suppose P122 = P132 = P142 = P182 = P192 = 120 and P112 = P152 = P162 = P172 = P1102 = 320.
Find P(A) and P(B).
Fantastic news! We've Found the answer you've been seeking!
Step by Step Answer:

Answered By
Daniel Kimutai
I am a competent academic expert who delivers excellent writing content from various subjects that pertain to academics. It includes Electronics engineering, History, Economics, Government, Management, IT, Religion, English, Psychology, Sociology, among others. By using Grammarly and Turnitin tools, I make sure that the writing content is original and delivered in time. For seven years, I have worked as a freelance writer, and many scholars have achieved their career dreams through my assistance.
1+ Reviews
10+ Question Solved
Related Book For 

Statistics Plus New Mylab Statistics With Pearson Etext Access Card Package
ISBN: 978-0134090436
13th Edition
Authors: James Mcclave ,Terry Sincich
Question Posted:
