The table on the next page gives the average high temperatures in January and July for several
Question:
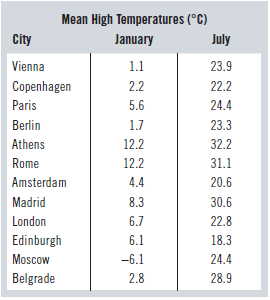
The table on the next page gives the average high temperatures in January and July for several European cities. Find a 90% confidence interval for the mean temperature difference between summer and winter in Europe. Be sure to check conditions for inference, and clearly explain what your interval means within the context of the situation.

Transcribed Image Text:
Mean High Temperatures (°C) City January July Vienna 1.1 23.9 Copenhagen Paris 2.2 22.2 24.4 5.6 Berlin 1.7 23.3 12.2 Athens 32.2 Rome 12.2 31.1 4.4 Amsterdam 20.6 Madrid 8.3 30.6 London 6.7 22.8 Edinburgh 6.1 18.3 Moscow -6.1 24.4 2.8 Belgrade 28.9
Fantastic news! We've Found the answer you've been seeking!
Step by Step Answer:
Answer rating: 92% (13 reviews)
Paired data assumption the data are paired by city Randomization ...View the full answer

Answered By

William Otieno
I am a professional tutor and a writer with excellent skills that are important in serving the bloggers and other specialties that requires a great writer. The important aspects of being the best are that I have served so many clients with excellence
With excellent skills, I have acquired very many recommendations which have made it possible for me to survive as an excellent and cherished writer. Being an excellent content writer am also a reputable IT writer with essential skills that can make one turn papers into excellent result.
4.70+
83+ Reviews
354+ Question Solved
Related Book For 

Business Statistics
ISBN: 9780133899122
3rd Canadian Edition
Authors: Norean D. Sharpe, Richard D. De Veaux, Paul F. Velleman, David Wright
Question Posted:
Students also viewed these Mathematics questions
-
Having done poorly on their final math exams in June, six students repeat the course in summer school and take another exam in August. If we consider these students to be representative of all...
-
For the following observational studies, indicate whether they are prospective or retrospective. a) An airline was concerned that new security measures might discourage air travellers. A year after...
-
A small Canadian mining company is issuing an initial public offering (IPO) of shares on the Vancouver Stock Exchange at $17 per share. A limited number of early investors were able to purchase these...
-
Give parametric equations and parameter intervals for the motion of a particle in the xy-plane. Identify the particles path by finding a Cartesian equation for it. Graph the Cartesian equation....
-
Show that (1 + z)2 = 1 + 2z + z2.
-
WellStar Kennestone Hospital swot analysis reference: https://careers.wellstar.org/us/en/wellstar-enterprise-support-team-west?utm_source=Google&utm_medium=CPC&utm_campaign=WEST-RN-December-21-Google...
-
Explain why the formula for sample variance is different from the formula for population variance.
-
Multiple Choice Questions 1. Walters, an individual, received the following in 2016: W-2 income .........................................................................$10,000 Federal tax refund for...
-
need help with weight average LIUMTA Lumpally uses the moving weighted average method for inventory costing. equired: he following incomplete inventory sheet regarding Product W506 is available for...
-
Use the Modified Euler method to approximate the solutions to each of the following initial-value problems, and compare the results to the actual values. a. y' = ety, 0 t 1, y(0) = 1, with h = 0.5;...
-
After implementing the fitness program described in Exercise 48, another company found that a random sample of 48 employees increased their productivity score from 49 to 56 with a standard deviation...
-
A company developing an ad campaign for its cola is investigating the impact of caffeine on studying in hopes of finding evidence of its claim that caffeine helps memory. The firm asked 30 subjects,...
-
Explain what a special purpose entity is and identify how the IASB requires these to be accounted for.
-
Using a ruler and set squares only, construct the following shapes: a. b. c. d. 5cm 5cm
-
The marketing department has just forecast that 10,000 units of item 778 will be ordered in the next fiscal year. Based on the marketing department's forecast and noting that the seasonal relative...
-
Following are interaction plots for three data sets. Which data set has the largest interactions? Which has the smallest? A B C
-
From your local chamber of commerce, obtain the population figures for your city for the years \(1980,1990,2000\), and 2010. Find the rate of growth for each period. Forecast the population of your...
-
A mass \(m\) is attached at the midpoint of a stretched wire of area of cross-section \(A\), length \(l\), and Young's modulus \(E\) as shown in Fig. 13.29. If the initial tension in the wire is...
-
Consider the Is_married_to unary relationship in Figure 8.14c. a. Assume that we want to know the date on which a marriage occurred. Augment this E-R diagram to include a Date_married attribute. b....
-
Experiment: Tossing four coins Event: Getting three heads Identify the sample space of the probability experiment and determine the number of outcomes in the event. Draw a tree diagram when...
-
The following Excel output summarizes the results of an analysis of variance experiment in which the treatments were three different hybrid cars and the variable measured was the miles per gallon...
-
An employee of a small software company in Minneapolis bikes to work during the summer months. He can travel to work using one of three routes and wonders whether the average commute times (in...
-
Before the recession, job-creating cities in the Sunbelt, like Las Vegas, Phoenix, and Orlando, saw their populations, income levels, and housing prices surge. Las Vegas, however, offered something...
-
Production numbers for 2 shifts are shown. The shift supervisor of Shift 2 insists to the production manager that her operators are more productive than the ones on Shift 1. Using a confidence level...
-
In a class, the scores that students got are as shown. What are the 25, 50, 75 and 100th percentiles for the data? 84 84 98 80 89 83 85 56 85 84 84 74 84 81 83 80 45 86 67 79 81 78 76 85 83 77 86 83...
-
Number of points made by Teams A and B are shown. Which statement is true based on running the F-Test Two-Sample for Variances in the Data Analysis pack in Excel? Use a confidence level of 10% to...

Study smarter with the SolutionInn App


