

Question: In Exercises 13 through 16, modify the least-squares procedure as illustrated in Example 7.4.4 to find a curve of the form y = Ae mx
In Exercises 13 through 16, modify the least-squares procedure as illustrated in Example 7.4.4 to find a curve of the form y = Aemx that best fits the given data.
(5, 33.5), (10, 22.5), (15, 15), (20, 10), (25, 6.8), (30, 4.5)
Data from Example 7.4.4.
A manufacturer gathers these data relating the level of production x (hundred units) of a particular commodity to the demand price p (dollars per unit) at which all x units will be sold:
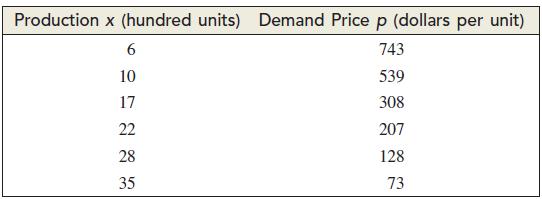
a. Plot a scatter diagram for the data on a graph with production level on the x axis and demand price on the y axis.
b. Notice that the scatter diagram in part (a) suggests that the demand function is exponential. Modify the least-squares procedure to find a curve of the form p = Aemx that best fits the data in the table.
c. Use the exponential demand function you found in part (b) to predict the revenue the manufacturer should expect if 4,000 (x = 40) units are produced.
Production x (hundred units) Demand Price p (dollars per unit) 743 539 308 207 128 73 6 10 17 22 28 35
Step by Step Solution
3.41 Rating (176 Votes )
There are 3 Steps involved in it
For the x z data and so m 008 and b 391 For the ... View full answer

Get step-by-step solutions from verified subject matter experts