

Question: Modify the least-squares procedure, as illustrated in Example 7.4.4, to find a function of the form P(t) = Ae rt whose graph best fits the
Modify the least-squares procedure, as illustrated in Example 7.4.4, to find a function of the form P(t) = Aert whose graph best fits the population data in Exercise 26, where P(t) is the U.S. population t decades after 1950.
a. Roughly at what percentage rate is the U.S. population growing?
b. Based on your population function, what would you expect the U.S. population to be in the year 2005? In 2010?
Data from Example 7.4.4.
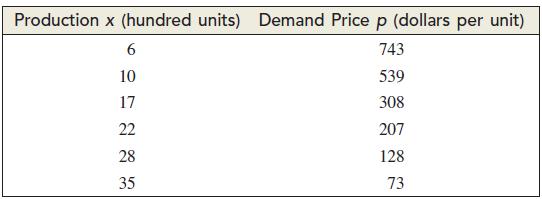
A manufacturer gathers these data relating the level of production x (hundred units) of a particular commodity to the demand price p (dollars per unit) at which all x units will be sold:
Data from Exercises 26
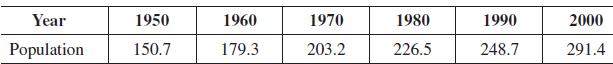
The accompanying table gives the U.S. decennial census figures (in millions) for the period 1950–2000:
Production x (hundred units) Demand Price p (dollars per unit) 743 539 308 207 128 73 6 10 17 22 28 35
Step by Step Solution
3.47 Rating (154 Votes )
There are 3 Steps involved in it
a Let x denote the number of decades after 1950 an... View full answer

Get step-by-step solutions from verified subject matter experts