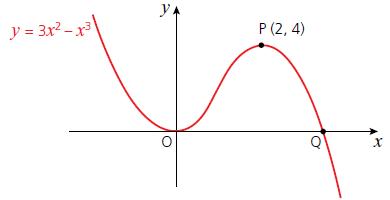
The sketch graph shows the curve of y = 3x 2 x 3 . The marked
Question:
The sketch graph shows the curve of y = 3x2 − x3. The marked point, P, has coordinates (2, 4).

a. Find:
i. The gradient function dy/dx
ii. The gradient of the curve at P
iii. The equation of the tangent at P
iv. The equation of the normal at P.
b. The graph touches the x-axis at the origin O and crosses it at the point Q.
Find:
i. The coordinates of Q
ii. The gradient of the curve at Q
iii. The equation of the tangent at Q.
c. Without further calculation, state the equation of the tangent to the curve at O.
Fantastic news! We've Found the answer you've been seeking!
Step by Step Answer:
Related Book For 

Cambridge IGCSE And O Level Additional Mathematics
ISBN: 9781510421646
1st Edition
Authors: Val Hanrahan, Jeanette Powell
Question Posted:


