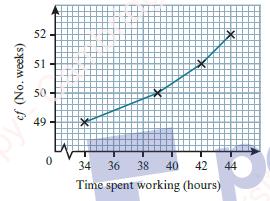
Last year Tom renovated an old building during which he worked for at least 9 hours each
Question:
Last year Tom renovated an old building during which he worked for at least 9 hours each week. By plotting four points in a graph, he has represented the time he spent working.

a. What can you say about the time that Tom spent working on the basis of this graph?
b. Explain why Tom’s graph might be considered to be misleading.
c. Name the different types of representation that are suitable for displaying the amount of time that Tom worked each week throughout the year.
Consider the benefits of each type of representation and then fully describe (but do not draw) the one you believe to be the most suitable.
Fantastic news! We've Found the answer you've been seeking!
Step by Step Answer:
Related Book For 

Cambridge International AS & A Level Mathematics Probability & Statistics 1 Coursebook
ISBN: 9781108407304
1st Edition
Authors: Dean Chalmers, Julian Gilbey
Question Posted:


