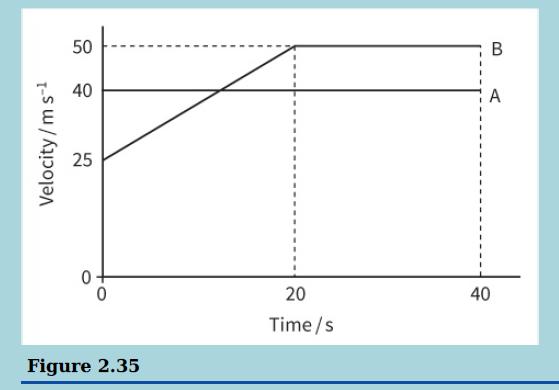
This graph shows the variation of velocity with time of two cars, A and B, Which are
Question:
This graph shows the variation of velocity with time of two cars, A and B, Which are travelling in the same direction over a period of time of 40 s.

Car A, travelling at a constant velocity of 40 m s−1, overtakes car B at time t = 0. In order to catch up with car A, car B immediately accelerates uniformly for 20 s to reach a constant velocity of 50 m s−1. Calculate:
a. The distance that A travels during the first 20 s
b. The acceleration and distance of travel of B during the first 20 s
c. The additional time taken for B to catch up with A
d. The distance each car will have then travelled since t = 0.
Fantastic news! We've Found the answer you've been seeking!
Step by Step Answer:
Related Book For 

Cambridge International AS And A Level Physics Coursebook
ISBN: 9781108859035
3rd Edition
Authors: David Sang, Graham Jones, Gurinder Chadha, Richard Woodside
Question Posted:


