

Question: Extend the various analyses of the teratology data (Table 4.5) in Section 13.3.3 as follows: a. Include a predictor for litter size (as well as
Extend the various analyses of the teratology data (Table 4.5) in Section 13.3.3 as follows:
a. Include a predictor for litter size (as well as group). Interpret, and compare results to those without this predictor.
b. Fit a model with beta-binomial variance (13.10) in which Ï varies by treatment group. Use results to motivate a model that allows overdispersion only in the placebo group. Interpret and compare results to those with common Ï for each group.
Table 4.5:
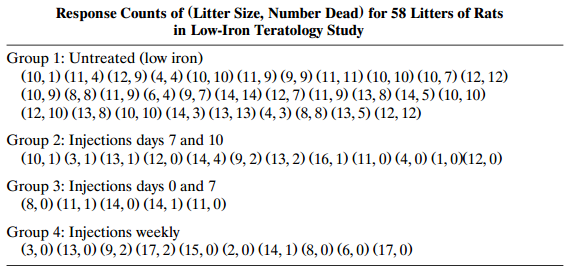
Response Counts of (Litter Size, Number Dead) for 58 Litters of Rats in Low-Iron Teratology Study Group 1: Untreated (low iron) (10, 1) (11, 4) (12, 9) (4, 4) (10, 10) (11, 9) (9, 9) (11, 11) (10, 10) (10, 7) (12, 12) (10, 9) (8, 8) (11,9) (6, 4) (9, 7) (14, 14) (12, 7) (11, 9) (13, 8) (14, 5) (10, 10) (12, 10) (13, 8) (10, 10) (14, 3) (13, 13) (4, 3) (8, 8) (13, 5) (12, 12) Group 2: Injections days 7 and 10 (10, 1) (3, 1) (13, 1) (12, 0) (14, 4) (9, 2) (13, 2) (16, 1) (11, 0) (4, 0) (1, 0X(12, 0) Group 3: Injections days 0 and 7 (8, 0) (11, 1) (14, 0) (14, 1) (11, 0) Group 4: Injections weekly (3, 0) (13, 0) (9, 2) (17, 2) (15, 0) (2, 0) (14, 1) (8, 0) (6, 0) (17,0)
Step by Step Solution
3.49 Rating (159 Votes )
There are 3 Steps involved in it
a Including litter size as a predictor its esti... View full answer

Get step-by-step solutions from verified subject matter experts