

Question: For Table 7.13, let Y = belief in life after death, x 1 = gender (1 = females, 0 = males), and x 2 =
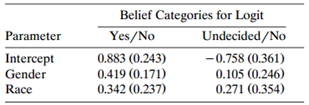
For Table 7.13, let Y = belief in life after death, x1= gender (1 = females, 0 = males), and x2= race (1 = whites, 0 = blacks). Table 7.14 shows the fit of the model log(πj/π3) = αj+ βjGx1+ βjRx2, j = 1, 2,
with SE values in parentheses.
Table 7.13:
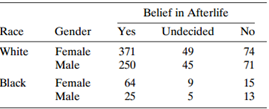
Table 7.14:
a. Find the prediction equation for log(Ï€1/Ï€2).
b. Using the yes and no response categories, interpret the conditional gender effect using a 95% confidence interval for an odds ratio.
c. Show that for white females, π̂1 = P̂(Y = yes) = 0.76.
d. For this fit, G2 = 0.9. Explain why residual df = 2. Deleting the gender effect, G2 = 8.0. Test whether opinion is independent of gender, given race. Interpret.
Belief in Afterlife Race Gender Yes Undecided No White Female Male 371 250 49 74 45 71 Black Female 64 9. 15 Male 25 13 Parameter Intercept Gender Belief Categories for Logit Yes/No 0.883 (0.243) 0.419 (0.171) 0.342 (0.237) Undecided/No -0.758 (0.361) 0.105 (0.246) 0.271 (0.354) Race
Step by Step Solution
3.49 Rating (175 Votes )
There are 3 Steps involved in it
a log 1 2 883 758 419 105x 1 342 271x 2 1641 524x ... View full answer

Get step-by-step solutions from verified subject matter experts