Answered step by step
Verified Expert Solution
Question
1 Approved Answer
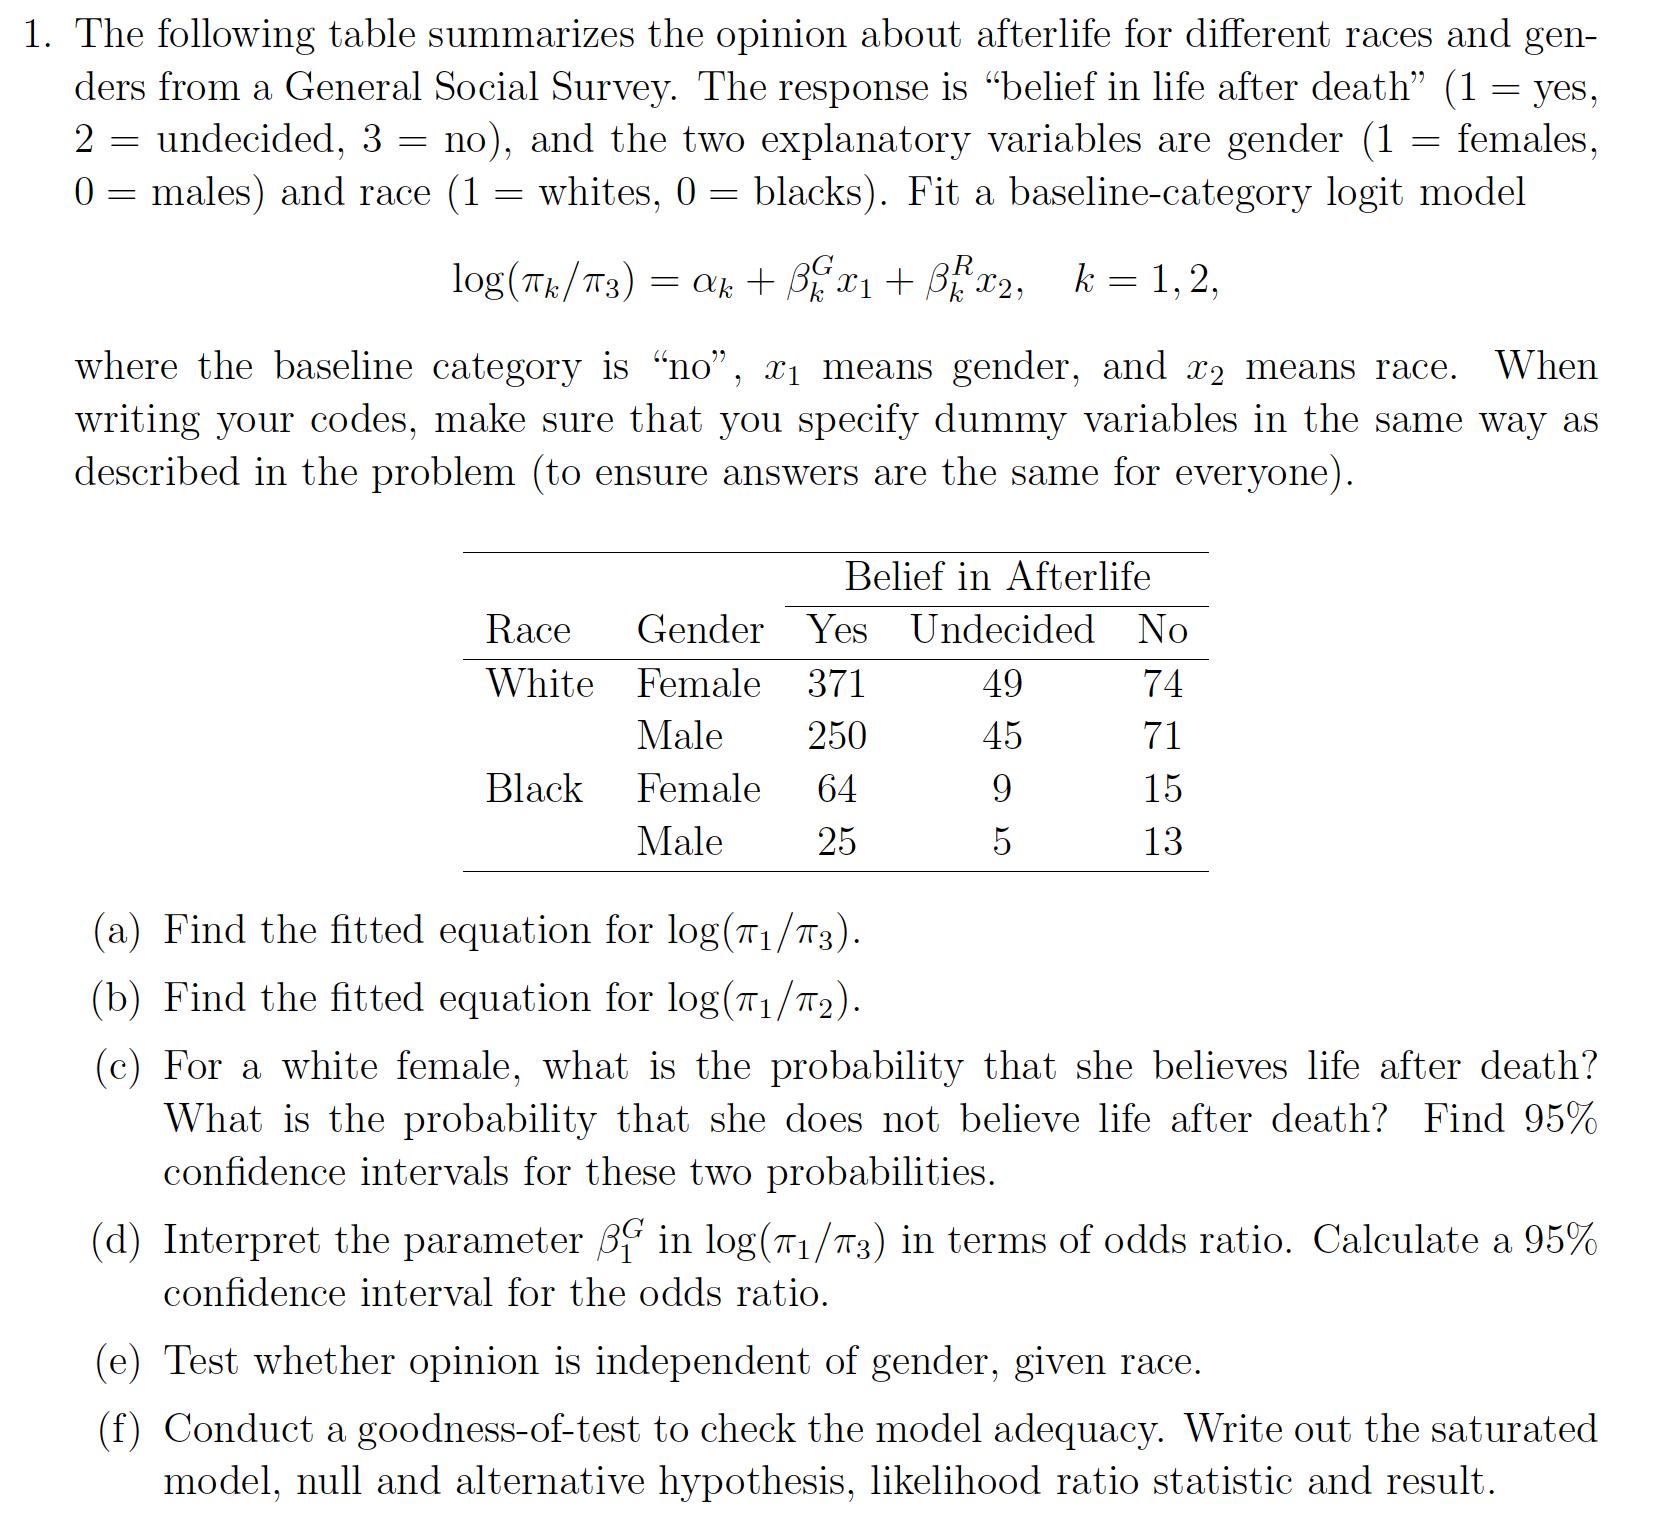
= 1. The following table summarizes the opinion about afterlife for different races and gen- ders from a General Social Survey. The response is

= 1. The following table summarizes the opinion about afterlife for different races and gen- ders from a General Social Survey. The response is "belief in life after death" yes, 2 undecided, 3 = no), and the two explanatory variables are gender (1 = females, 0 males) and race (1 = whites, 0 = blacks). Fit a baseline-category logit model = = b log(Tk/3)=ak + x1 + x2, k = 1,2, where the baseline category is "no", x means gender, and x2 means race. When writing your codes, make sure that you specify dummy variables in the same way as described in the problem (to ensure answers are the same for everyone). Belief in Afterlife Race Gender Yes Undecided No White Female 371 49 74 Male 250 45 71 Black Female 64 9 15 Male 25 5 13 (a) Find the fitted equation for log(1/3). (b) Find the fitted equation for log(1/2). (c) For a white female, what is the probability that she believes life after death? What is the probability that she does not believe life after death? Find 95% confidence intervals for these two probabilities. (d) Interpret the parameter BG in log(71/73) in terms of odds ratio. Calculate a 95% confidence interval for the odds ratio. (e) Test whether opinion is independent of gender, given race. (f) Conduct a goodness-of-test to check the model adequacy. Write out the saturated. model, null and alternative hypothesis, likelihood ratio statistic and result.
Step by Step Solution
There are 3 Steps involved in it
Step: 1
Solutions Step 1 Goodnessoffit tests are techniques that make conclusion about observed values For instance it can define if a sample group is truly representative of whole population As such determin...
Get Instant Access to Expert-Tailored Solutions
See step-by-step solutions with expert insights and AI powered tools for academic success
Step: 2

Step: 3

Ace Your Homework with AI
Get the answers you need in no time with our AI-driven, step-by-step assistance
Get Started


