Draw lines of constant Gibbs and Helmholtz energies on the diagrams of Illustration 6.4-1 Illustration 6.4-1 Making
Question:
Draw lines of constant Gibbs and Helmholtz energies on the diagrams of Illustration 6.4-1
Illustration 6.4-1
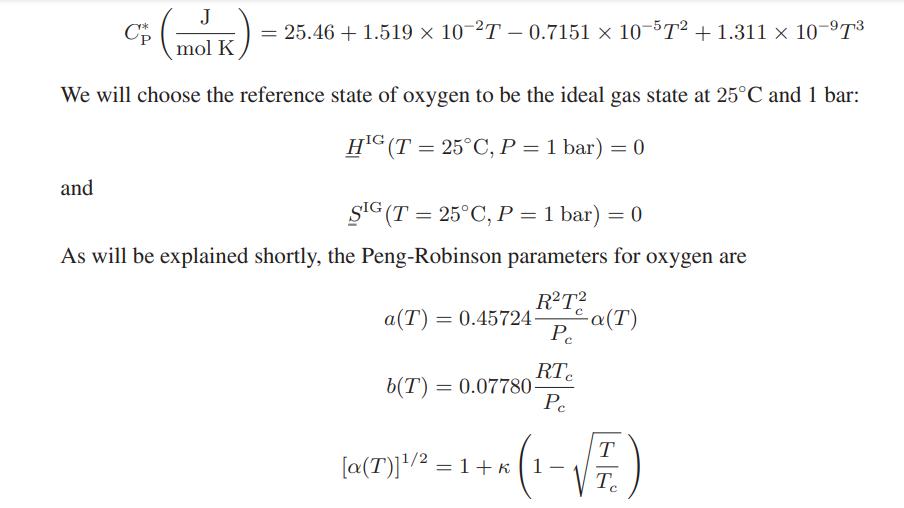
Making of a Thermodynamic Properties Chart As an introduction to the problem of constructing a chart or table of the thermodynamic properties of a real fluid, develop a thermodynamic properties chart for oxygen over the temperature range of −100◦C to +150◦C and a pressure range of 1 to 100 bar. In particular, calculate the compressibility factor, specific volume, molar enthalpy, and molar entropy as a function of temperature and pressure. Also, prepare a pressure-volume plot, a pressure-enthalpy plot (see Fig. 3.4-2), and a temperature-entropy plot (see Fig. 3.4-3) for oxygen. Data: For simplicity we will assume oxygen obeys the Peng-Robinson equation of state and has an ideal gas heat capacity given by

Figure 3.4-3

Figure 3.4-2

Step by Step Answer:

Chemical Biochemical And Engineering Thermodynamics
ISBN: 9780470504796
5th Edition
Authors: Stanley I. Sandler


