

Plot equilibrium data from Table 13-A1 for tri-ethylamine (solvent), carbon tetrachloride (solute), acetic acid (diluent) on a
Question:
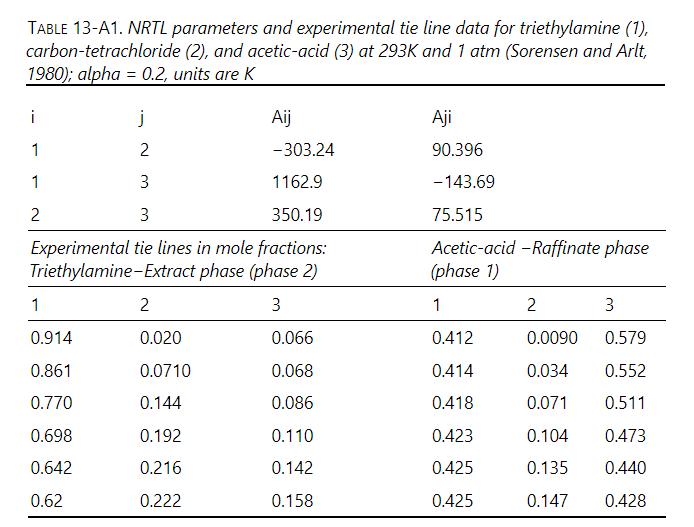
Plot equilibrium data from Table 13-A1 for tri-ethylamine (solvent), carbon tetrachloride (solute), acetic acid (diluent) on a right triangle diagram with ordinate \(=\) mole fraction \(\mathrm{CCl}_{4}\) and abscissa \(=\) mole fraction acetic acid. Solve following two stage crossflow problem graphically. \(\mathrm{F}=10 \mathrm{kmol} / \mathrm{h}\), and feed is \(10 \mathrm{~mol}_{2} \mathrm{CCl}_{4}\) and \(90 \mathrm{~mol} \%\) acetic acid. Entering solvent is pure and \(10 \mathrm{kmol} / \mathrm{h}\) are added to each stage. Find mole fractions and flow rates of extract streams and raffinate stream.
Table 13-A1
Step by Step Answer:

This question has not been answered yet.
You can Ask your question!
Related Book For 
Separation Process Engineering Includes Mass Transfer Analysis
ISBN: 9780137468041
5th Edition
Authors: Phillip Wankat
Question Posted:
