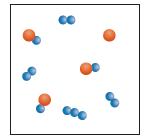
Equal amounts of two gases, A and B 3 , are placed in an evacuated container and
Question:
Equal amounts of two gases, A and B3, are placed in an evacuated container and react to form AB and B2.
![]()
The molecular scale diagram represents the relative amounts of each substance present once equilibrium is reached.

Which of the following graphs best describes the progress of the reaction as it proceeds to equilibrium? Explain why the graph you chose must be the correct one.

Fantastic news! We've Found the answer you've been seeking!
Step by Step Answer:
Related Book For 

Chemistry For Engineering Students
ISBN: 9780357026991
4th Edition
Authors: Lawrence S. Brown, Tom Holme
Question Posted:


