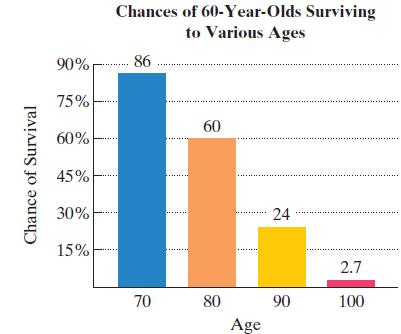
The bar graph shows your chances of surviving to various ages once you reach 60. The functions
Question:
The bar graph shows your chances of surviving to various ages once you reach 60.
 The functions
 model the chance, as a percent, that a 60-year-old will survive to age x. Use this information to solve Exercises 101–102.
a. Find and interpret f(90).b. Find and interpret g(90).c. Which function serves as a better model for the chance of surviving to age 90?
Fantastic news! We've Found the answer you've been seeking!
Step by Step Answer:
Related Book For 

Question Posted:


