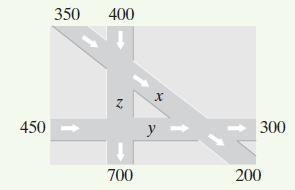
The figure shows the intersections of three one-way streets. The numbers given represent traffic flow, in cars
Question:
The figure shows the intersections of three one-way streets. The numbers given represent traffic flow, in cars per hour, at a peak period (from 4 p.m. to 6 p.m.).
a. Use the idea that the number of cars entering each intersection per hour must equal the number of cars leaving per hour to set up a system of linear equations involving x, y, and z.
b. Use Gaussian elimination to solve the system.
c. If construction limits the value of z to 400, how many cars per hour must pass between the other intersections to keep traffic flowing?
Fantastic news! We've Found the answer you've been seeking!
Step by Step Answer:
Related Book For 

Question Posted:


