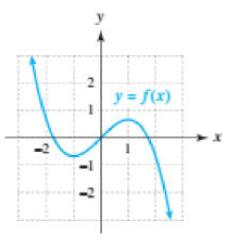
Use the graph to determine if f is odd. even, or neither. y = f(x) x
Question:
Use the graph to determine if f is odd. even, or neither.
Transcribed Image Text:
y = f(x) x
Fantastic news! We've Found the answer you've been seeking!
Step by Step Answer:
Answer rating: 66% (3 reviews)
From the graph we can see that ...View the full answer

Answered By

Asim farooq
I have done MS finance and expertise in the field of Accounting, finance, cost accounting, security analysis and portfolio management and management, MS office is at my fingertips, I want my client to take advantage of my practical knowledge. I have been mentoring my client on a freelancer website from last two years, Currently I am working in Telecom company as a financial analyst and before that working as an accountant with Pepsi for one year. I also join a nonprofit organization as a finance assistant to my job duties are making payment to client after tax calculation, I have started my professional career from teaching I was teaching to a master's level student for two years in the evening.
My Expert Service
Financial accounting, Financial management, Cost accounting, Human resource management, Business communication and report writing. Financial accounting : • Journal entries • Financial statements including balance sheet, Profit & Loss account, Cash flow statement • Adjustment entries • Ratio analysis • Accounting concepts • Single entry accounting • Double entry accounting • Bills of exchange • Bank reconciliation statements Cost accounting : • Budgeting • Job order costing • Process costing • Cost of goods sold Financial management : • Capital budgeting • Net Present Value (NPV) • Internal Rate of Return (IRR) • Payback period • Discounted cash flows • Financial analysis • Capital assets pricing model • Simple interest, Compound interest & annuities
4.40+
65+ Reviews
86+ Question Solved
Related Book For 

College Algebra With Modeling And Visualization
ISBN: 9780134418049
6th Edition
Authors: Gary Rockswold
Question Posted:
Students also viewed these Mathematics questions
-
Use the graph to determine if f is odd. even, or neither. -2-1 2 y = f(x) X
-
Use the graph to determine if f is odd. even, or neither. -2 y 2 77 y = f(x) 2
-
Use the graph to determine if f is odd. even, or neither. y = f(x) 2
-
Ancient Indians did not believe in war and violence when it came it an expansion of political territory but relied on peaceful negotiation and strategy. Please explain your views on this quote with...
-
Carol Carpet manufactures broadloom carpet in seven processes: spinning, dyeing, plying, spooling, tufting, latexing, and shearing. In the Dyeing Department, direct materials (dye) are added at the...
-
At December 31, 2020, Cord Company's plant asset and accumulated depreciation and amortization accounts had balances as follows: Category Plant Asset Accumulated Depreciation and Amortization Land $...
-
1 How do you think Cameron Balloons should manage resources (human, equipment and materials) to deal with variation in demand?
-
The financial statements of P&G are presented in Appendix 5B or can be accessed at the books companion website, Instructions Refer to P&Gs financial statements and accompanying notes to answer the...
-
H. (3) How much would the 40-year-old investor have to save each year to accumulate the same amount at 65 as the 20-year-old investor? (Hints: FV is the same as your answer in H(1). Number of years...
-
The data on the next page are modeled exactly by a linear, quadratic, cubic, or quartic function f with leading coefficient a. All zeros of f are real numbers located in the interval [-3,3]. (a) Make...
-
For each f(x), complete the following. (a) Find the x- and y-intercepts. (b) Determine the multiplicity of each zero of f. (c) Sketch a graph of y = f(x) by hand. f(x) = (x + 1)(x - 2)
-
Are there any disadvantages to offering PTO?
-
Verify the results of Eq. (14.48) for the properties of the chiral projection operators. Data from Eq. 14.48 P = P+ P+ + P = 1 P_P+ P+P = 0 Py" = y P
-
Prove that the estimating equations in (11.13) are unbiased under MCAR, but are generally biased without the stringent MCAR assumption. (x) [y - f (xt;)] = 0, i=1 (11.13)
-
Refer to Figure 11.5: Which is the most expensive subcontract for this project? How much were the costs for the general contractor's crews for item 4? Figure 11.5 Division 1 2 3 4 5 6 7 Work Gen'l...
-
a. Using observations on the change in consumption \(D C_{t}=C_{t}-C_{t-1}\) and the change in income \(D Y_{t}=\) \(Y_{t}-Y_{t-1}\) from 1959Q3 to 2015Q4, obtained from the data file cons_inc,...
-
Water at \(20^{\circ} \mathrm{C}\) flows by gravity from a large reservoir at a high elevation to a smaller one through a 35-m-long, 5-cm-diameter cast iron piping system that includes four standard...
-
How many significant figures are there in the following values? (a) 0.05 10 -4 (b) 0.00340 (c) 7.2 10 4 (d) 103.00
-
In the busy port of Chennai, India, the number of containers loaded onto ships during a 15-week period is as follows: 1. Develop a linear trend equation to forecast container loadings. 2. Using the...
-
Show that B is the multiplicative inverse of A, where 3 A = 2] and B = [- 1 -1 2 -3 2
-
For Exercises 4550, write out the first three terms and the last term. Then use the formula for the sum of the first n terms of an arithmetic sequence to find the indicated sum. 30 (-3i + 5) i=1
-
Determine whether the values in each table belong to an exponential function, a logarithmic function, a linear function, or a quadratic function. . X 0 1 2 3 4 y 7 4 1 -2 -5 b. X 0 1 2 3 4 0 y 1 4...
-
The number of hours studied and the scores that students earned are shown. Creating a scatter chart, which statement is true regarding the relationship between the hours of study and scores earned....
-
Five samples of 12 each were extracted from a population. Based on the central limit theorem, what is the best estimate of the SD of the population? A B C D E 270 230 290 238 315 303 274 270 246 244...
-
In a national test, the mean score was 1575 and the standard deviation was 85. What % of the students earned a score between1500 and 1600 if the scores were Normally distributed?

Study smarter with the SolutionInn App


