

Figure P16.54 shows the PV diagrams for a variety of different processes involving an ideal gas. (a)
Question:
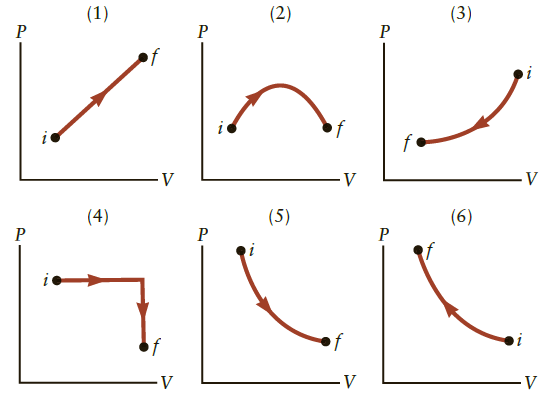
Figure P16.54 shows the P–V diagrams for a variety of different processes involving an ideal gas.
(a) Which diagrams describe an expansion?
(b) Which diagrams describe a compression?
(c) Which diagrams might describe an adiabatic process?
(d) Which diagrams might describe an isothermal process?
Figure P16.54
Fantastic news! We've Found the answer you've been seeking!
Step by Step Answer:
We can examine from the diagrams what is happening to P and V and recall that PV nRT T...View the full answer

Answered By
AJIN KURIAKOSE
I HAVE ELECTRONICS ENGINEERING DEGREE..AND MY AREA OF INTEREST IS MATHEMATICS,CONTROL SYSTEM,NETWORK,DIGITAL
21+ Reviews
32+ Question Solved
Related Book For 
College Physics Reasoning and Relationships
ISBN: 978-0840058195
2nd edition
Authors: Nicholas Giordano
Question Posted:
