

Question: The diagram shows the curve y = 9 x and the line y = 5. Find the shaded area. YA 10. -4 -3 -2
The diagram shows the curve y = 9 − x² and the line y = 5.
Find the shaded area.
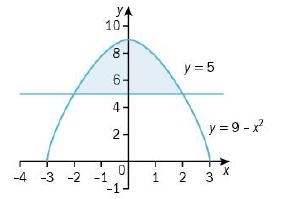
YA 10. -4 -3 -2 -1 00 8 6 4 2-4 0 -1 1 y = 5 y=9-x 2 3 X
Step by Step Solution
★★★★★
3.37 Rating (153 Votes )
There are 3 Steps involved in it
1 Expert Approved Answer
Step: 1 Unlock

To find the shaded area we first need to determine the p... View full answer
Question Has Been Solved by an Expert!
Get step-by-step solutions from verified subject matter experts
Step: 2 Unlock
Step: 3 Unlock