Energy proportionality (sometimes also referred to as energy scale-down) is the attribute of the system to consume
Question:
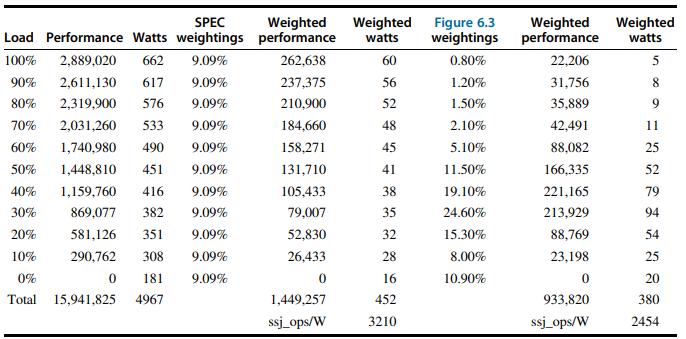
Energy proportionality (sometimes also referred to as energy scale-down) is the attribute of the system to consume no power when idle, but more importantly gradually consume more power in proportion to the activity level and work done. In this exercise, we will examine the sensitivity of energy consumption to different energy proportionality models. In the exercises below, unless otherwise mentioned, use the data in Figure 6.4 as the default.
a. A simple way to reason about energy proportionality is to assume linearity between activity and power usage. Using just the peak power and idle power data from Figure 6.4 and a linear interpolation, plot the energy-efficiency trends across varying utilizations. (Energy efficiency is expressed as performance per watt.) What happens if idle power (at 0% activity) is half of what is assumed in Figure 6.4? What happens if idle power is zero?
b. Plot the energy-efficiency trends across varying activities, but use the data from column 3 of Figure 6.4 for power variation. Plot the energy efficiency assuming that the idle power (alone) is half of what is assumed in Figure 6.4. Compare these plots with the linear model in the previous exercise. What conclusions can you draw about the consequences of focusing purely on idle power alone?
c. Assume the system utilization mix in column 7 of Figure 6.4. For simplicity, assume a discrete distribution across 1000 servers, with 109 servers at 0% utilization, 80 servers at 10% utilization, etc. Compute the total performance and total energy for this workload mix using the assumptions in part (a) and part (b).
d. One could potentially design a system that has a sublinear power versus load relationship in the region of load levels between 0% and 50%. This would have an energy-efficiency curve that peaks at lower utilizations (at the expense of higher utilizations). Create a new version of column 3 from Figure 6.4 that shows such an energy-efficiency curve. Assume the system utilization mix in column 7 of Figure 6.4. For simplicity, assume a discrete distribution across 1000 servers, with 109 servers at 0% utilization, 80 servers at 10% utilizations, etc. Compute the total performance and total energy for this workload mix.
Figure 6.4:

Step by Step Answer:

Computer Architecture A Quantitative Approach
ISBN: 9780128119051
6th Edition
Authors: John L. Hennessy, David A. Patterson


