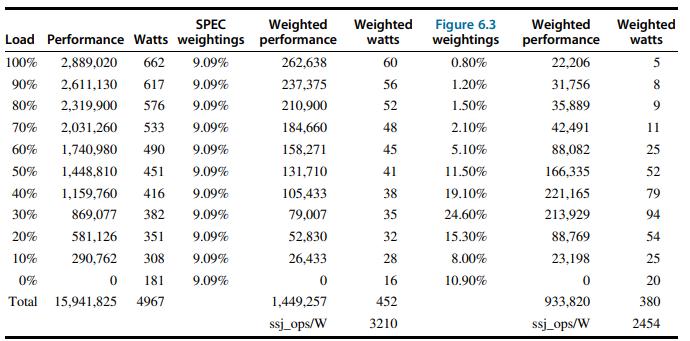
Question: This exercise illustrates the interactions of energy proportionality models with optimizations such as server consolidation and energy-efficient server designs. Consider the scenarios shown in Figures
This exercise illustrates the interactions of energy proportionality models with optimizations such as server consolidation and energy-efficient server designs. Consider the scenarios shown in Figures 6.38 and 6.39.
a. Consider two servers with the power distributions shown in Figure 6.38: case A (the server considered in Figure 6.4) and case B (a less energy-proportional but more energy-efficient server than case A). Assume the system utilization mix in column 7 of Figure 6.4. For simplicity, assume a discrete distribution across 1000 servers, with 109 servers at 0% utilization, 80 servers at 10% utilizations, etc., as shown in row 1 of Figure 6.39. Assume performance variation based on column 2 of Figure 6.4. Compare the total performance and total energy for this workload mix for the two server types.
b. Consider a cluster of 1000 servers with data similar to the data shown in Figure 6.4 (and summarized in the first rows of Figures 6.38 and 6.39). What are the total performance and total energy for the workload mix with these assumptions?
Now assume that we were able to consolidate the workloads to model the distribution shown in case C (second row of Figure 6.39). What are the total performance and total energy now? How does the total energy compare with a system that has a linear energy-proportional model with idle power of zero watts and peak power of 662 W?
c. Repeat part (b), but with the power model of server B, and compare with the results of part (a).
Figure 6.38:

Figure 6.39:

Figure 6.4:

Activity (%) Power, case A (W) Power, case B (W) 0 181 250 10 20 30 40 50 308 351 382 416 451 490 275 325 340 395 405 415 60 70 533 425 80 90 100 576 617 662 440 445 450
Step by Step Solution
3.49 Rating (162 Votes )
There are 3 Steps involved in it
Understanding the Figures Figure 638 Appears the control utilization in Watts of two server sorts A and B at distinctive movement levels 0 to 100 Figure 639 Appears the number of servers at each actio... View full answer

Get step-by-step solutions from verified subject matter experts


