

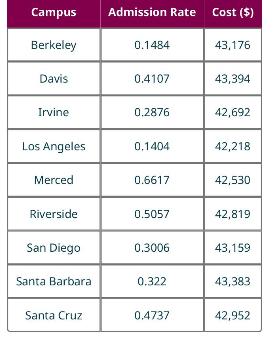
Create a bar graph that illustrates the differences in admission rates among the different campuses. The following
Question:
Create a bar graph that illustrates the differences in admission rates among the different campuses.
The following are data on the admission rates of the different branch campuses in the University of California system, along with the out-of-state tuition and fee cost:
Step by Step Answer:

This question has not been answered yet.
You can Ask your question!
Related Book For 

Question Posted:
