

Create a histogram of the data. Use bins of width 5 . Employees at a college help
Question:
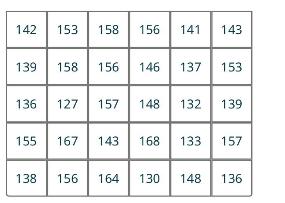
Create a histogram of the data. Use bins of width 5 .
Employees at a college help desk track the number of people who request assistance each week. The table gives a sample of the results:
Fantastic news! We've Found the answer you've been seeking!
Step by Step Answer:

Answered By
Mugdha Sisodiya
My self Mugdha Sisodiya from Chhattisgarh India. I have completed my Bachelors degree in 2015 and My Master in Commerce degree in 2016. I am having expertise in Management, Cost and Finance Accounts. Further I have completed my Chartered Accountant and working as a Professional.
Since 2012 I am providing home tutions.
2+ Reviews
10+ Question Solved
Related Book For 

Question Posted:
