

Question: A linear dynamic model of the -subsystem of a grid connected voltage source converter (VSC) using a Y-Y transformer is shown in Figure P8.20 (a)
A linear dynamic model of the α-subsystem of a grid connected voltage source converter (VSC) using a Y-Y transformer is shown in Figure P8.20 (a) (Mahmood, 2012).
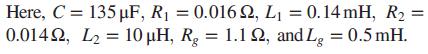
a. Find the transfer function GP(s) = Vα(s)/Mα(s).
b. If GP(s) is the plant in Figure P8.20(b) and GC(s) = K, use MATLAB to plot the root locus. On a closeup of the locus (from -300 to 0 on the real axis and from -50 to 5000 on the imaginary axis), find K and the coordinates of the dominant poles, which correspond to ζ = 0.012. Plot the output response, c(t) = vα(t), at that value of the gain when a step input, r(t)= vr (t)= 208 u(t) volts, is applied at t = 0. Mark on the time response graph, c(t), all relevant characteristics, such as the percent overshoot, peak time, rise time, settling time, and final steady-state value.
Here, C = 135 F, R1 = 0.016 2, L1 = 0.14 mH, R2 0.0142, L2 = 10 H, Rg = 1.1 , and Le = 0.5 mH. %3D
Step by Step Solution
3.32 Rating (164 Votes )
There are 3 Steps involved in it

Get step-by-step solutions from verified subject matter experts