

Question: The following table gives data on gold prices, the Consumer Price Index (CPI), and the New York Stock Exchange (NYSE) Index for the United States
The following table gives data on gold prices, the Consumer Price Index (CPI), and the New York Stock Exchange (NYSE) Index for the United States for the period 1974 €“2006. The NYSE Index includes most of the stocks listed on the NYSE, some 1500-plus.
a. Plot in the same scattergram gold prices, CPI, and the NYSE Index.
b. An investment is supposed to be a hedge against inflation if its price and /or rate of return at least keeps pace with inflation. To test this hypothesis, suppose you decide to fit the following model, assuming the scatterplot in (a) suggests that this is appropriate:
Gold pricet = β1 = + β2 CPIt + ut
NYSE indext = β1 + β2 CPIt + ut
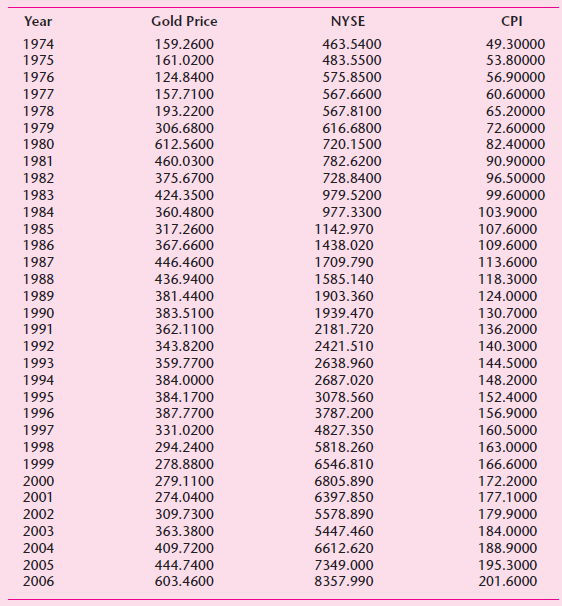
Gold Price CPI Year NYSE 1974 159.2600 463.5400 49.30000 1975 161.0200 483.5500 53.80000 1976 1977 124.8400 575.8500 56.90000 157.7100 567.6600 60.60000 1978 193.2200 567.8100 65.20000 1979 306.6800 616.6800 72.60000 612.5600 1980 720.1500 82.40000 1981 460.0300 782.6200 90.90000 1982 375.6700 728.8400 96.50000 1983 424.3500 979.5200 99.60000 1984 360.4800 977.3300 103.9000 107.6000 1985 317.2600 1142.970 1986 367.6600 1438.020 109.6000 1987 446.4600 1709.790 113.6000 1585.140 1903.360 436.9400 1988 118.3000 1989 381.4400 124.0000 1990 1991 383.5100 1939.470 130.7000 362.1100 2181.720 136.2000 343.8200 1992 2421.510 140.3000 359.7700 1993 2638.960 144.5000 1994 384.0000 2687.020 148.2000 1995 384.1700 3078.560 152.4000 1996 387.7700 3787.200 156.9000 1997 331.0200 4827.350 160.5000 294.2400 1998 5818.260 163.0000 1999 278.8800 6546.810 166.6000 172.2000 2000 279.1100 6805.890 6397.850 2001 274.0400 177.1000 2002 309.7300 5578.890 179.9000 2003 363.3800 5447.460 184.0000 2004 409.7200 6612.620 188.9000 195.3000 2005 444.7400 7349.000 603.4600 2006 8357.990 201.6000
Step by Step Solution
3.51 Rating (184 Votes )
There are 3 Steps involved in it
a If you plot these variables against time you will see that there is considerable pric... View full answer

Get step-by-step solutions from verified subject matter experts
Document Format (2 attachments)
1529_605d88e1cbd53_656156.pdf
180 KBs PDF File
1529_605d88e1cbd53_656156.docx
120 KBs Word File