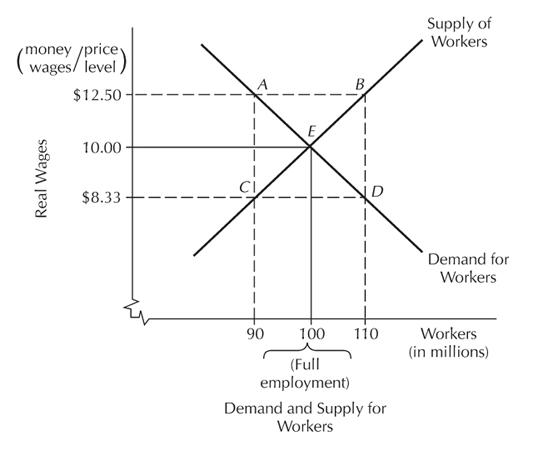
Using the same set of circumstances used in Question 8, label the price levels for the aggregate
Question:
Using the same set of circumstances used in Question 8, label the price levels for the aggregate supply curve when the real money wage is $10. Assume that 90 million workers produce a GDP of $500 billion, 100 million produce a real GDP of $600 billion, and 110 million produce a real GDP of $650 billion, all three amounts being in real dollars.
Data From Question 8:
Assume that at full employment, the demand for workers equals supply at a real wage of $10; the quantity demanded and supplied is 100 million. The money wage is fixed in the short run at $10, and the price level at full employment is 100. The solid lines in the following graph show this. The “Demand and Supply for Workers” graph shows that as real wages go down, firms demand more workers but fewer workers want to work. Assume that employment equals the employers’ demand for workers in the short run because the workers are under contract to work the hours the employers demand. Where will the economy be on the graph if the price level falls to 80? Rises to 120?

Step by Step Answer:


