

Plot the risk-return combinations in the following table in a graph with the expected return measured on
Question:
Plot the risk-return combinations in the following table in a graph with the expected return measured on the vertical axis and the risk on the horizontal axis. If an investor claimed to be indifferent among these four investments, how would you classify his attitude toward risk? If he were a risk-averse investor, how would you expect a plot of equally attractive investments to be sloped?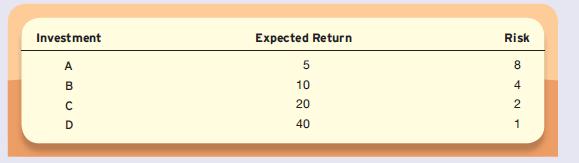
Step by Step Answer:

This question has not been answered yet.
You can Ask your question!
Related Book For 
Money Banking And Financial Markets
ISBN: 9780073375908
3rd Edition
Authors: Stephen Cecchetti, Kermit Schoenholtz
Question Posted:
