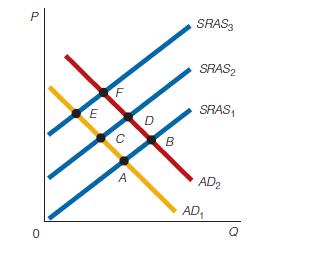
1.5 In the following figure, which of the points is representative of each of the following: a...
Question:
1.5 In the following figure, which of the points is representative of each of the following:
a The lowest Real GDP b The highest Real GDP c A decrease in SRAS that is greater than an increase in AD

Fantastic news! We've Found the answer you've been seeking!
Step by Step Answer:
Related Book For 

Question Posted:


