

The histogram shows the distribution of hurricanes that have hit the U.S. mainland from 1851 through 2019
Question:
The histogram shows the distribution of hurricanes that have hit the U.S. mainland from 1851 through 2019 by Saffir-Simpson category, where 1 is the weakest level and 5 is the strongest level.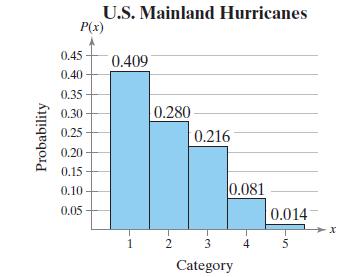
In Exercises 29–34,
(a) find the mean, variance, and standard deviation of the probability distribution, and
(b) interpret the results.
Fantastic news! We've Found the answer you've been seeking!
Step by Step Answer:

Answered By
Susan Juma
I'm available and reachable 24/7. I have high experience in helping students with their assignments, proposals, and dissertations. Most importantly, I'm a professional accountant and I can handle all kinds of accounting and finance problems.
15+ Reviews
45+ Question Solved
Related Book For 
Question Posted:
