

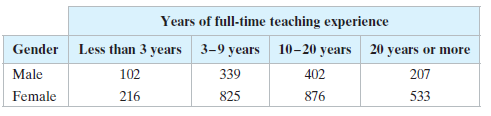
Question: The contingency table shows the results of a random sample of public elementary and secondary school teachers by gender and years of full-time teaching experience.
The contingency table shows the results of a random sample of public elementary and secondary school teachers by gender and years of full-time teaching experience. At α = 0.01, can you conclude that gender is related to the years of full-time teaching experience?
(a) Find the expected frequency for each cell in the contingency table,
(b) Identify the claim and state H0 and Ha,
(c) Determine the degrees of freedom, find the critical value, and identify the rejection region,
(d) Find the chi-square test statistic,
(e) Decide whether to reject or fail to reject the null hypothesis, and
(f ) Interpret the decision in the context of the original claim.
Years of full-time teaching experience Gender Less than 3 years 102 216 3-9 years 339 825 10-20 years 20 years or more 207 533 402 Male Female 876
Step by Step Solution
3.35 Rating (176 Votes )
There are 3 Steps involved in it
a Expected frequencies b The claim is gender is related to the years ... View full answer

Get step-by-step solutions from verified subject matter experts