Question:
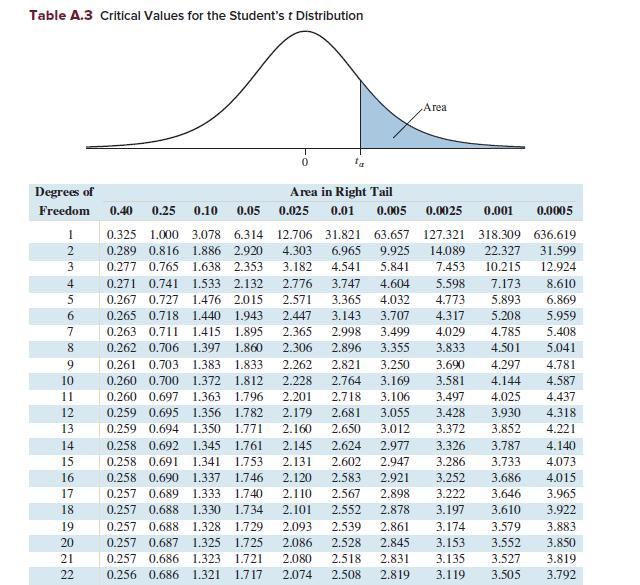
Find the P-value for the following values of the test statistic t, sample size n, and alternate hypothesis H1. If you use Table A.3, you may specify that P is between two values.
a. t = −1.584, n = 19, H1: μ ≠ μ0
b. t = −2.473, n = 41, H1: μ
c. t = 1.491, n = 30, H1: μ ≠ μ0
d. t = 3.635, n = 4, H1: μ > μ0

Transcribed Image Text:
Table A.3 Critical Values for the Student's t Distribution Area Degrees of Freedom Area in Right Tail 0.40 0.25 0.10 0.05 0.025 0.01 0.005 0.0025 0.001 0.0005 1 0.325 1.000 3.078 6.314 12.706 31.821 2 0.289 0.816 1.886 2.920 4.303 6.965 3 0.277 0.765 1.638 2.353 3.182 4.541 4 0.271 0.741 1.533 2.132 2.776 63.657 9.925 5.841 3.747 4.604 5 0.267 0.727 1.476 2.015 2.571 127.321 318.309 636.619 14.089 22.327 31.599 7.453 10.215 12.924 5.598 3.365 4.032 4.773 7.173 8.610 5.893 6.869 6 0.265 0.718 1.440 1.943 2.447 3.143 3.707 4.317 5.208 5.959 7 0.263 0.711 1.415 1.895 2.365 2.998 3.499 4.029 4.785 5.408 8 0.262 0.706 1.397 1.860 2.306 2.896 3.355 3.833 4.501 5.041 9 0.261 0.703 1.383 1.833 2.262 2.821 3.250 3.690 4.297 4.781 10 0.260 0.700 1.372 1.812 2.228 11 0.260 0.697 1.363 1.796 2.201 2.718 12 0.259 0.695 1.356 1.782 2.179 2.764 3.169 3.581 3.106 3.497 2.681 3.055 3.428 4.144 4.587 4.025 4.437 3.930 4.318 13 0.259 0.694 1.350 1.771 2.160 2.650 3.012 3.372 3.852 4.221 14 0.258 0.692 1.345 1.761 2.145 2.624 2.977 3.326 3.787 4.140 15 0.258 0.691 1.341 1.753 2.131 2.602 2.947 3.286 3.733 4.073 16 0.258 0.690 1.337 1.746 2.120 2.583 2.921 3.252 3.686 4.015 17 0.257 0.689 1.333 1.740 2.110 2.567 2.898 3.222 3.646 3.965 18 0.257 0.688 1.330 1.734 2.101 2.552 2.878 3.197 3.610 3.922 19 0.257 0.688 1.328 1.729 2.093 2.539 2.861 3.174 3.579 3.883 20 0.257 0.687 1.325 1.725 2.086 2.528 2.845 3.153 3.552 3.850 21 0.257 0.686 1.323 1.721 2.080 22 0.256 0.686 1.321 1.717 2.074 2.518 2.831 2.508 2.819 3.135 3.527 3.819 3.119. 3.505 3.792


