

Pick 4 Lottery The dotplot below depicts individual digits selected in the Pick 4 lottery from different
Question:
Pick 4 Lottery The dotplot below depicts individual digits selected in the Pick 4 lottery from different states. Can the original list of individual sample digits be identified? Can the sample data be used to construct a 95% confidence interval estimate of the population standard deviation for all such digits? Why or why not?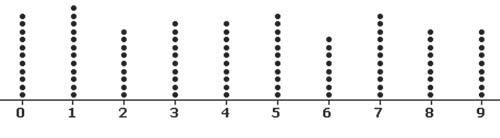
Fantastic news! We've Found the answer you've been seeking!
Step by Step Answer:

Answered By
Hassan Ali
I am an electrical engineer with Master in Management (Engineering). I have been teaching for more than 10years and still helping a a lot of students online and in person. In addition to that, I not only have theoretical experience but also have practical experience by working on different managerial positions in different companies. Now I am running my own company successfully which I launched in 2019. I can provide complete guidance in the following fields. System engineering management, research and lab reports, power transmission, utilisation and distribution, generators and motors, organizational behaviour, essay writing, general management, digital system design, control system, business and leadership.
1+ Reviews
10+ Question Solved
Related Book For 

Elementary Statistics Using Excel Pearson New
ISBN: 978-1292041766
5th Edition
Authors: Mario F Triola
Question Posted:
