

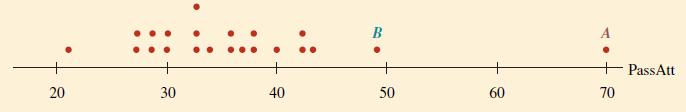
The following dotplot shows the number of attempted passes thrown by the quarterbacks for 22 of the
Question:
The following dotplot shows the number of attempted passes thrown by the quarterbacks for 22 of the NFL teams that played on one particular Sunday afternoon.
a. Describe the distribution, including how points A and B relate to the others.
b. If you remove point A, and maybe point B, would you say the remaining data have an approximately normal distribution? Explain.
c. Based on the information about distributions that Chebyshev’s theorem and the empirical rule give us, how typical an event do you think point A represents? Explain.
Fantastic news! We've Found the answer you've been seeking!
Step by Step Answer:

Answered By
Omar ELmoursi
I'm Omar, I have Bachelor degree in Business and Finance, My unique approach is to help students with questions and assignments, I can teach Business, Math, Accounting, Managerial Accounting, Economy, Human resources management, organizational behavior, project management, I have experience dealing with different types of students and teach them how to deal with different types of exercises.
4+ Reviews
10+ Question Solved
Related Book For 

Just The Essentials Of Elementary Statistics
ISBN: 9780495314875
10th Edition
Authors: Robert Johnson, Patricia Kuby
Question Posted:
