Use a random-number table or a computer to simulate rolling a pair of dice 100 times. a.
Question:
Use a random-number table or a computer to simulate rolling a pair of dice 100 times.
a. List the results of each roll as an ordered pair and the sum.
b. Prepare an ungrouped frequency distribution and a histogram of the sums.
c. Describe how these results compare with what you expect to occur when two dice are rolled.
TECHNOLOGY INSTRUCTIONS: SIMULATE DICE MINITAB (Release 14)
Choose: Calc Random Data Integer Enter: Generate: 100 Store in column(s): C1 C2 Minimum value: 1 Maximum value: 6 OK Choose: Calc Calculator Enter: Store result in variable: C3 Expression: C1 C2 OK Choose: Stat Tables Tally Individual Variables Enter: Variable: C3 Select: Counts OK Use the MINITAB commands on page 61 to construct a frequency histogram of the data in C3.
(Use Binning midpoint and midpoint positions 2:12/1 if necessary.)
Excel Enter 1, 2, 3, 4, 5, 6 into column A, label C1: Die1;
D1: Die2; E1: Dice, and activate B1.
Choose: Format Cells Number Number Enter: Decimal places: 8 OK Enter: 1/6 in B1 Drag: Bottom right corner of B1 down for 6 entries Choose: Tools Data Analysis Random Number Generation
OK Enter: Number of Variables: 2 Number of Random Numbers: 100 Distribution: Discrete Value and Probability Input Range: (A1:B6 or select cells)
Select: Output Range Enter: (C2 or select cells) OK Activate the E2 cell.
Enter: C2 D2 Enter Drag: Bottom right corner of E2 down for 100 entries Choose: Data Pivot and PivotChart Table Report . . .
Select: Microsoft Excel list or database Next Enter: Range: (E1:E101 or select cells) Next Select: Existing Worksheet Enter: (F1 or select cell)
Choose: Layout Drag: “Dice” heading into both row & data areas Double click the “sum of dice” in data area box;
then continue with:
Choose: Summarize by: Count OK OK Finish Label column J “sums” and input the numbers 2, 3, 4, . . . , 12 into it. Use the Excel histogram commands on pages 61–62 with column E as the input range and column J as the bin range.
TI-83/84 Plus Choose: MATH PRB 5:randInt(
Enter: 1,6,100)
Choose: STO0 2nd L1 Repeat preceding for L2.
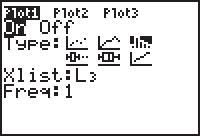
Choose: STAT EDIT 1:Edit Highlight: L3 Enter: L3 L1 L2 Choose: 2nd STAT PLOT
1:Plot1 Choose: WINDOW Enter: .5, 12.5, 1,
10, 40, 10,1 Choose: TRACE

Step by Step Answer:

Just The Essentials Of Elementary Statistics
ISBN: 9780495314875
10th Edition
Authors: Robert Johnson, Patricia Kuby


