

Question: Test data for the small Francis turbine shown in Fig. P12.64 is given in the following table. The test was run at a constant (32.8-mathrm{ft})
Test data for the small Francis turbine shown in Fig. P12.64 is given in the following table. The test was run at a constant \(32.8-\mathrm{ft}\)
Figure P12.64
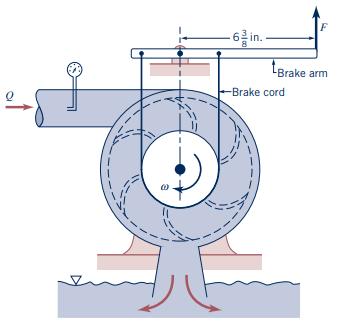
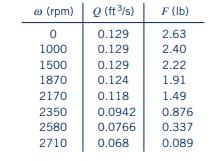
head just upstream of the turbine. The Prony brake on the turbine output shaft was adjusted to give various angular velocities, and the force on the brake arm, \(F\), was recorded. Use the given data to plot curves of torque as a function of angular velocity and turbine efficiency as a function of angular velocity.
6in. F -Brake arm -Brake cord
Step by Step Solution
★★★★★
3.51 Rating (154 Votes )
There are 3 Steps involved in it
1 Expert Approved Answer
Step: 1 Unlock

Question Has Been Solved by an Expert!
Get step-by-step solutions from verified subject matter experts
Step: 2 Unlock
Step: 3 Unlock