Question
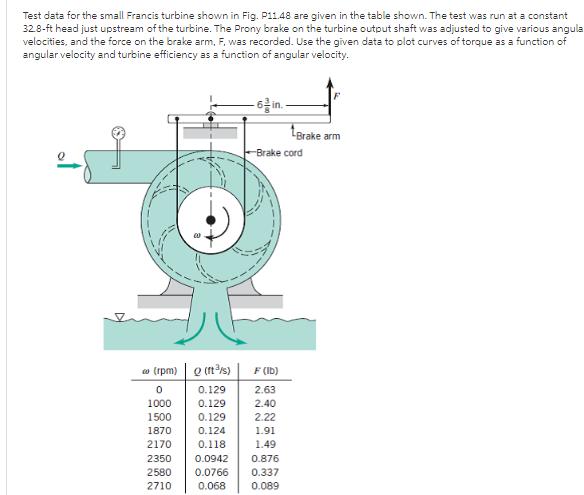
Test data for the small Francis turbine shown in Fig. P11.48 are given in the table shown. The test was run at a constant

Test data for the small Francis turbine shown in Fig. P11.48 are given in the table shown. The test was run at a constant 32.8-ft head just upstream of the turbine. The Prony brake on the turbine output shaft was adjusted to give various angula velocities, and the force on the brake arm, F. was recorded. Use the given data to plot curves of torque as a function of angular velocity and turbine efficiency as a function of angular velocity. LBrake arm Brake cord w (rpm)e n's) F (Ib) 0.129 2.63 1000 0.129 2.40 1500 0.129 2.22 1870 0.124 1.91 2170 0.118 1.49 2350 0.0942 0.876 2580 0.0766 0.337 2710 0.068 0.089 of
Step by Step Solution
3.41 Rating (154 Votes )
There are 3 Steps involved in it
Step: 1
Solution ...
Get Instant Access to Expert-Tailored Solutions
See step-by-step solutions with expert insights and AI powered tools for academic success
Step: 2

Step: 3

Ace Your Homework with AI
Get the answers you need in no time with our AI-driven, step-by-step assistance
Get StartedRecommended Textbook for
System Dynamics
Authors: William Palm III
3rd edition
73398063, 978-0073398068
Students also viewed these Mechanical Engineering questions
Question
Answered: 1 week ago
Question
Answered: 1 week ago
Question
Answered: 1 week ago
Question
Answered: 1 week ago
Question
Answered: 1 week ago
Question
Answered: 1 week ago
Question
Answered: 1 week ago
Question
Answered: 1 week ago
Question
Answered: 1 week ago
Question
Answered: 1 week ago
Question
Answered: 1 week ago
Question
Answered: 1 week ago
Question
Answered: 1 week ago
Question
Answered: 1 week ago
Question
Answered: 1 week ago
Question
Answered: 1 week ago
Question
Answered: 1 week ago
Question
Answered: 1 week ago
Question
Answered: 1 week ago
Question
Answered: 1 week ago
Question
Answered: 1 week ago
Question
Answered: 1 week ago
Question
Answered: 1 week ago
Question
Answered: 1 week ago
View Answer in SolutionInn App


