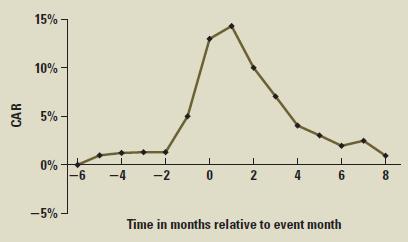
Cumulative Abnormal Returns The following diagram shows the cumulative abnormal returns (CAR) for 386 oil exploration companies
Question:
Cumulative Abnormal Returns The following diagram shows the cumulative abnormal returns (CAR) for 386 oil exploration companies announcing oil discoveries between 1950 and 1980. Month 0 in the diagram is the announcement month. Assume that no other information is received and the stock market as a whole does not move. Is the diagram consistent with market efficiency? Why or why not?

Fantastic news! We've Found the answer you've been seeking!
Step by Step Answer:
Related Book For 

Corporate Finance With Connect Access Card
ISBN: 978-1259672484
10th Edition
Authors: Stephen Ross ,Randolph Westerfield ,Jeffrey Jaffe
Question Posted:


