Question:
A spreadsheet containing Hennes & Mauritz’s actual and forecasted financial statements as well as the valuation described in this chapter is available on the companion website of this book.
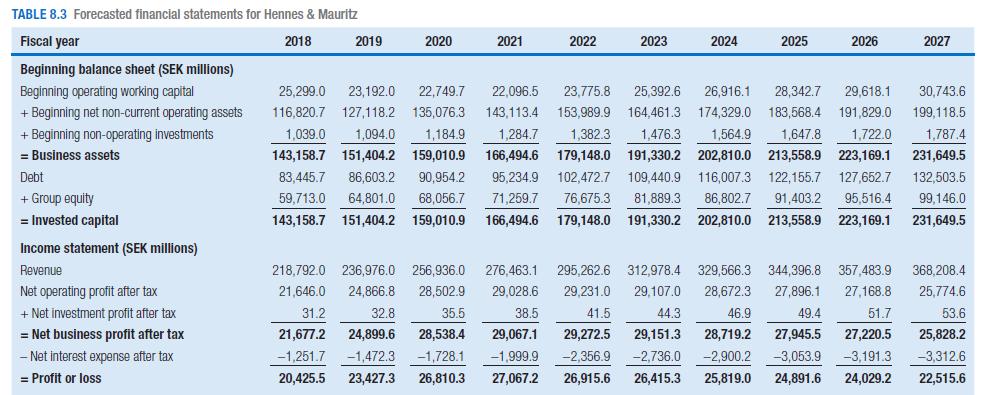
How will the forecasts in Table 8.3 and the value estimates in Table 8.6 for H&M change if the company defies the forces of competition and maintains a revenue growth rate of 10 percent from 2018 to 2025 (and all the other assumptions are kept unchanged)?

Transcribed Image Text:
TABLE 8.3 Forecasted financial statements for Hennes & Mauritz 2019 2020 2021 2022 2023 2024 2025 2026 2027 Fiscal year 2018 Beginning balance sheet (SEK millions) Beginning operating working capital + Beginning net non-current operating assets 1,039.0 1,094.0 1,184.9 143,158.7 151,404.2 159,010.9 + Beginning non-operating investments = Business assets Debt + Group equity = Invested capital Income statement (SEK millions) Revenue 25,299.0 23,192.0 22,749.7 22,096.5 23,775.8 25,392.6 26,916.1 28,342.7 29,618.1 30,743.6 116,820.7 127,118.2 135,076.3 143,113.4 153,989.9 164,461.3 174,329.0 183,568.4 191,829.0 199,118.5 1,284.7 1,382.3 1,476.3 1,564.9 1,647.8 1,722.0 1,787.4 166,494.6 179,148.0 191,330.2 202,810.0 213,558.9 223,169.1 231,649.5 83,445.7 86,603.2 90,954.2 95,234.9 102,472.7 109,440.9 116,007.3 122,155.7 127,652.7 132,503.5 59,713.0 64,801.0 68,056.7 71,259.7 76,675.3 81,889.3 86,802.7 91,403.2 95,516.4 99,146.0 143,158.7 151,404.2 159,010.9 166,494.6 179,148.0 191,330.2 202,810.0 213,558.9 223,169.1 231,649.5 Net operating profit after tax 21,646.0 29,028.6 218,792.0 236,976.0 256,936.0 276,463.1 295,262.6 312,978.4 329,566.3 344,396.8 357,483.9 24,866.8 28,502.9 368,208.4 + Net investment profit after tax 31.2 32.8 35.5 38.5 = Net business profit after tax 21,677.2 24,899.6 28,538.4 - Net interest expense after tax -1,251.7 =Profit or loss -1,472.3 -1,728.1 20,425.5 23,427.3 26,810.3 29,107.0 41.5 44.3 29,067.1 29,272.5 29,151.3 -1,999.9 -2,356.9 -2,736.0 27,067.2 26,915.6 26,415.3 29,231.0 28,672.3 27,896.1 46.9 28,719.2 -2,900.2 27,168.8 49.4 51.7 27,945.5 27,220.5 25,828.2 -3,053.9 -3,191.3 -3,312.6 25,819.0 24,891.6 24,029.2 22,515.6 25,774.6 53.6


