Comparing Income Statements and Balance Sheets of Competitors Following are selected income statement and balance sheet data
Question:
Comparing Income Statements and Balance Sheets of Competitors Following are selected income statement and balance sheet data from two retailers, Abercrombie &
Fitch (clothing retailer in the high-end market) and TJX Companies (clothing retailer in the value-priced market), for the fiscal year ended January 30, 2016.
Income Statement ($ thousands) ANF TJX Sales. . . . . . . . . . . . . . . . . . . . . . . . . . . . . . . . . . . . . . . . . . . . . . . . . . . $3,518,680 $30,944,938 Cost of goods sold. . . . . . . . . . . . . . . . . . . . . . . . . . . . . . . . . . . . . . . . 1,361,137 22,034,523 Gross profit. . . . . . . . . . . . . . . . . . . . . . . . . . . . . . . . . . . . . . . . . . . . . . 2,157,543 8,910,415 Total expenses . . . . . . . . . . . . . . . . . . . . . . . . . . . . . . . . . . . . . . . . . . . 2,121,967 6,632,757 Net income . . . . . . . . . . . . . . . . . . . . . . . . . . . . . . . . . . . . . . . . . . . . . . $ 35,576 $ 2,277,658 Balance Sheet ($ thousands) ANF TJX Current assets . . . . . . . . . . . . . . . . . . . . . . . . . . . . . . . . . . . . . . . . . . . $1,178,980 $ 6,772,560 Long-term assets . . . . . . . . . . . . . . . . . . . . . . . . . . . . . . . . . . . . . . . . . 1,254,059 4,726,922 Total assets. . . . . . . . . . . . . . . . . . . . . . . . . . . . . . . . . . . . . . . . . . . . . . $2,433,039 $11,499,482 Current liabilities. . . . . . . . . . . . . . . . . . . . . . . . . . . . . . . . . . . . . . . . . . $ 534,703 $ 4,402,230 Long-term liabilities . . . . . . . . . . . . . . . . . . . . . . . . . . . . . . . . . . . . . . . 602,614 2,790,177 Total liabilities . . . . . . . . . . . . . . . . . . . . . . . . . . . . . . . . . . . . . . . . . . . . 1,137,317 7,192,407 Stockholders’ equity . . . . . . . . . . . . . . . . . . . . . . . . . . . . . . . . . . . . . . 1,295,722 4,307,075 Total liabilities and equity . . . . . . . . . . . . . . . . . . . . . . . . . . . . . . . . . . . $2,433,039 $11,499,482
a. Express each income statement amount as a percentage of sales. Comment on any differences observed between these two companies, especially as they relate to their respective business models.
b. Express each balance sheet amount as a percentage of total assets. Comment on any differences observed between these two companies, especially as they relate to their respective business models.
c. Which company has a lower proportion of debt? What do the ratios tell us about the relative riskiness of the two companies?
Step by Step Answer:

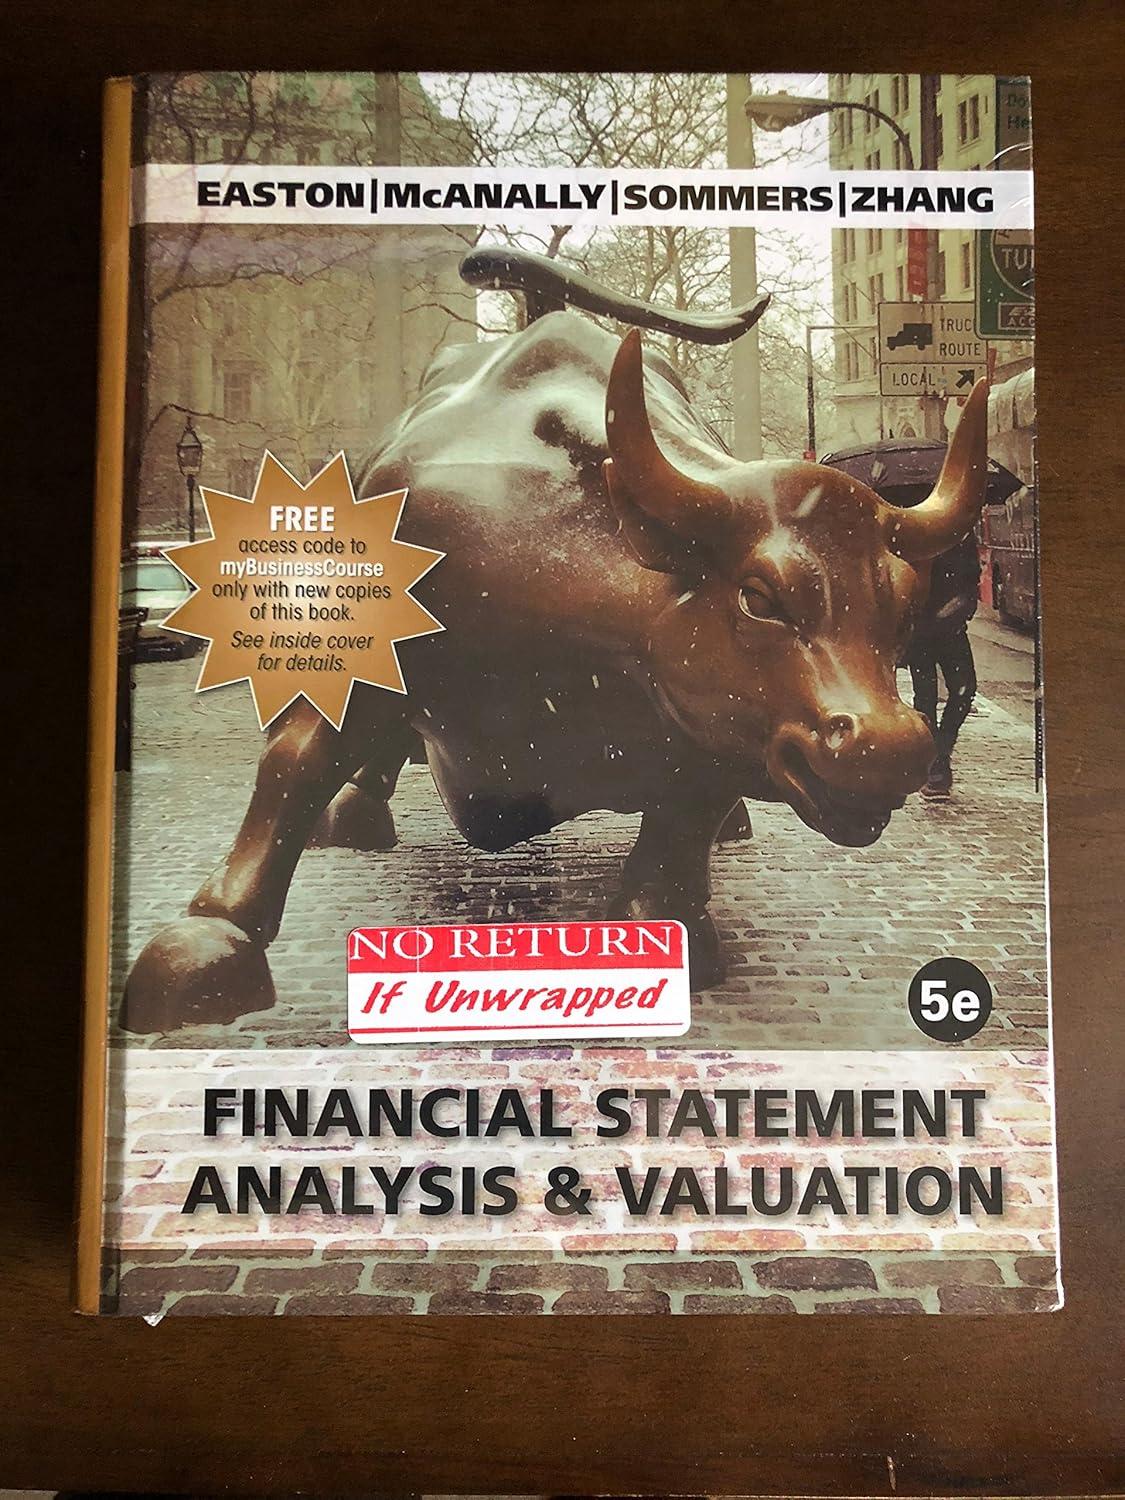
Financial Statement Analysis And Valuation
ISBN: 9781618532336
5th Edition
Authors: Peter D. Easton, Mary Lea McAnally, Gregory A. Sommers


