Question:
E4.14. An Examination of Revenues: Microsoft (Medium) Microsoft Corp. reported $36.835 billion in revenues for fiscal year 2004. Accounts receivable, net of allowances, increased from $5.196 billion in 2003 to $5.890 billion. Microsoft has been criticized for underreporting revenue. Revenue from software licensed to computer manufacturers is not recognized in the income statement until the manufacturer sells the computers. Other revenues are recognized over contract periods with customers. As a result, Microsoft reported a liability, unearned revenue, of $6.514 billion in 2004, down from $7.225 billion in 2003. What was the cash generated from revenues in 2004? Real World Connection See Exercises El.6, E6.13, E7.7, E8.10, E10.11, B17.10, and E194, and Minicases M8.1, and M12.2 for related material on Microsoft.
Transcribed Image Text:
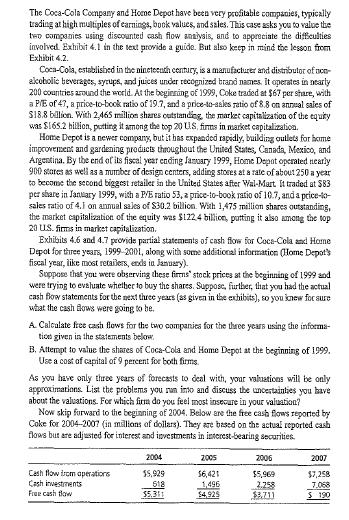
The Coca-Cola Company and Home Depot have been very profitable companies, typically trading at high multiples of earnings, book values, and sales. This case asks you to value the two companies using discounted cash flow analysis, and to appreciate the difficulties involved. Exhibit 4.1 in the text provide a guide. But also keep in mind the lesson from Exhibit 4.2. Coca-Cola, established in the nineteenth century, is a manufacturer and distributor of non- alcoholic beverages, syrups, and juices under recognized brand names. It operates in nearly 200 countries around the world. At the beginning of 1999, Coke traded at $67 per share, with a P/E of 47, a price-to-book ratio of 19.7, and a price-to-asles ratio of 8.8 on annual sales of $18.8 billion. With 2,465 million shares outstanding, the market capitalization of the equity was $165.2 billion, putting it among the top 20 US, firms in market capitalization. Home Depot is a newer company, but it has expanded rapidly, building outlets for home improvement and gardening products throughout the United States, Canada, Mexico, and Argentina. By the end of its fiscal year ending January 1999, Home Depot operated nearly 900 stores as well as a number of design centers, adding stores at a rate of about 250 a year to become the second biggest retailer in the United States after Wal-Mart. It traded at $83 per share in January 1999, with a P/E ratio 53, a price-to-book ratio of 10.7, and a price-to- sales ratio of 4.1 on annual sales of $30.2 billion. With 1,475 million shares outstanding, the market capitalization of the equity was $122.4 billion, putting it also among the top 20 US. firms in market capitalization. Exhibits 4.6 and 4.7 provide partial statements of cash flow for Coca-Cola and Home Depot for three years, 1999-2001, along with some additional information (Home Depot's fiscal year, like most retailers, ends in January). Suppose that you were observing these firms' stock prices at the beginning of 1999 and were trying to evaluate whether to buy the shares. Suppose, further, that you had the actual cash flow statements for the next three years (as given in the exhibits), so you knew for sure what the cash flows were going to be. A. Calculate free cash flows for the two companies for the three years using the informa- tion given in the statements below. B. Attempt to value the shares of Coca-Cola and Home Depot at the beginning of 1999.. Use a cost of capital of 9 percent for both firms. As you have only three years of forecasts to deal with, your valuations will be only approximations. List the problems you run into and discuss the uncertainties you have about the valuations. For which firm do you feel most insecure in your valuation? Now skip forward to the beginning of 2004. Below are the free cash flows reported by Coke for 2004-2007 (in millions of dollars). They are based on the actual reported cash flows but are adjusted for interest and investments in interest-bearing securities. 2004 2005 2006 2007 Cash flow from operations 15,929 $6,421 $5,969 $7,258 Cash investments 518 1,496 2.258 7,068 Free cash flow $5.311 $4,925 $3.711 $ 190