

Cl.9. Figure 1.2plots a price-to-value ratio (PIV) for the Dow Jones Industrial Average (DJIA) from 1979 to
Question:
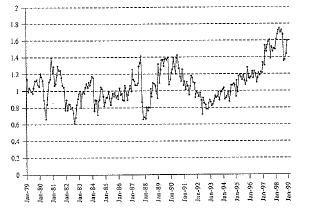
Cl.9. Figure 1.2plots a price-to-value ratio (PIV) for the Dow Jones Industrial Average
(DJIA) from 1979 to 1999. APN ratiois a metricthatcompares themarketprice(P)
to anestimate of intrinsic value(V).Theintrinsic valueinthe figure isbasedontechniques that will be discussed in this book. Buthowit is calculated is not important for the following questions:
a. Up to 1996, the PN ratio fluctuated around 1.0. What do you make of this pattern?
b. Ifyouhadpurchased the Dow 30stocks eachtimethePN ratiofellbelow 0.8and hadsoldthemeachtimethep/V ratioroseabove1.2,wouldyourinvestment strategy haveperformed well?
c. Whatinterpretation do you put on the continuing upward movement of the PN ratioafter 1995?
Step by Step Answer:


Financial Statement Analysis And Security Valuation
ISBN: 9780071267809
4th International Edition
Authors: Penman-Stephen-H, Steven Penman
